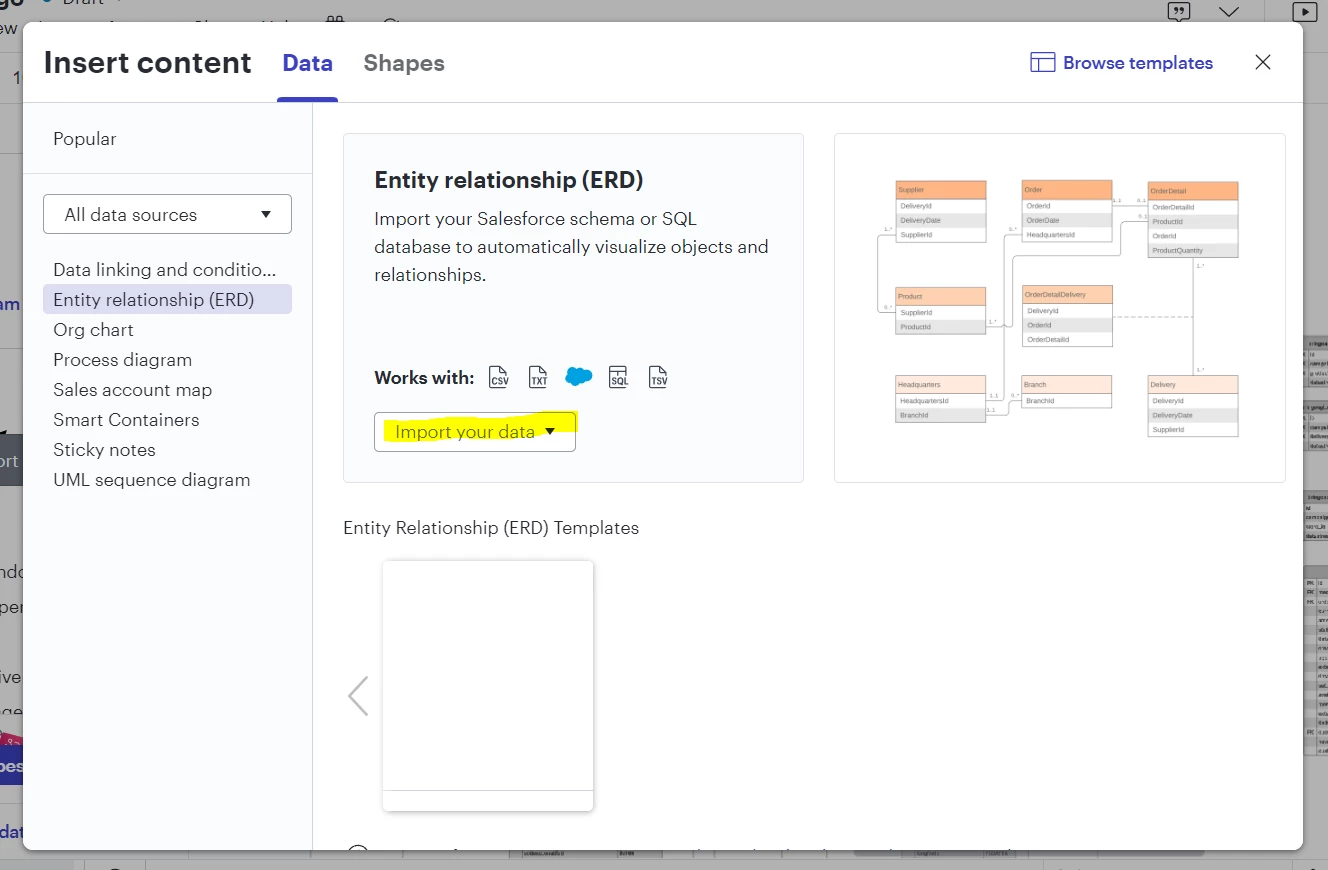
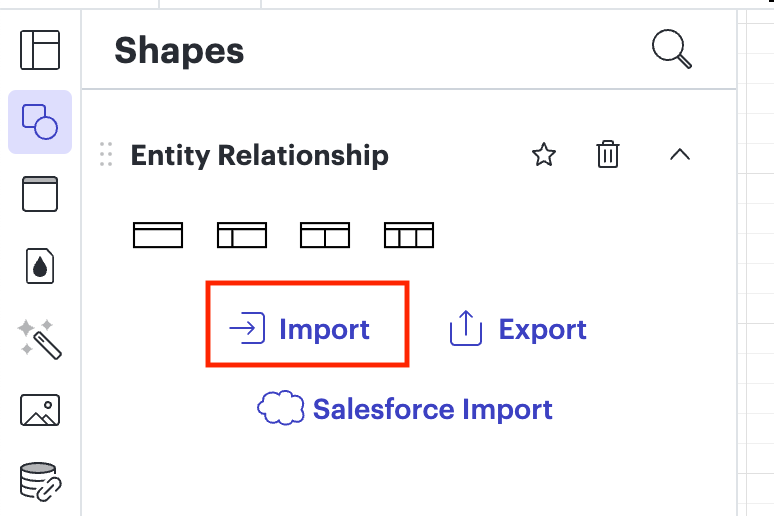
I am very new to this but...I got my .csv file to import into LucidChart. I can see all of the tables. I clicked on the tables one at a time and no relationships were drawn. Now I don’t know what to do.
I looked at the .csv file and the PKs and FKs are indicated for each table in the file. How do I create the ERD and have the relationships show up?
Import an ERD and display the relationships in Lucidchart
 +1
+1Best answer by Amelia W
Hi
Going forward, if your DBMS is not formally supported in Lucid, or if you run into any import errors, you can write a custom query and run it in your database. Then, the example file can be used to help you generate an output file in the format our ERD importer expects.
For any other users that might have questions about ERD’s, I recommend reviewing our Create an Entity Relationship Diagram in Lucidchart article from the Lucid Help Center for more information about the set up and intended functionality.
Create an account in the community
A Lucid account is required to interact with the Community, and your participation is subject to the Supplemental Lucid Community Terms. You may not participate in the Community if you are under age 18. You will be redirected to the Lucid app to log in.
Log in to the community
A Lucid account is required to interact with the Community, and your participation is subject to the Supplemental Lucid Community Terms. You may not participate in the Community if you are under age 18. You will be redirected to the Lucid app to log in.
Log in with Lucid
Enter your E-mail address. We'll send you an e-mail with instructions to reset your password.


