I am attempting to make a change log page on my Lucid Chart. I have no idea where to begin. Googling hasnt helped me much. Any ideas would be greatly appreciated.
Solved
Creating a Change Log Page using tables in Lucidchart
 +1
+1Best answer by Kelsey Gaag
Hi
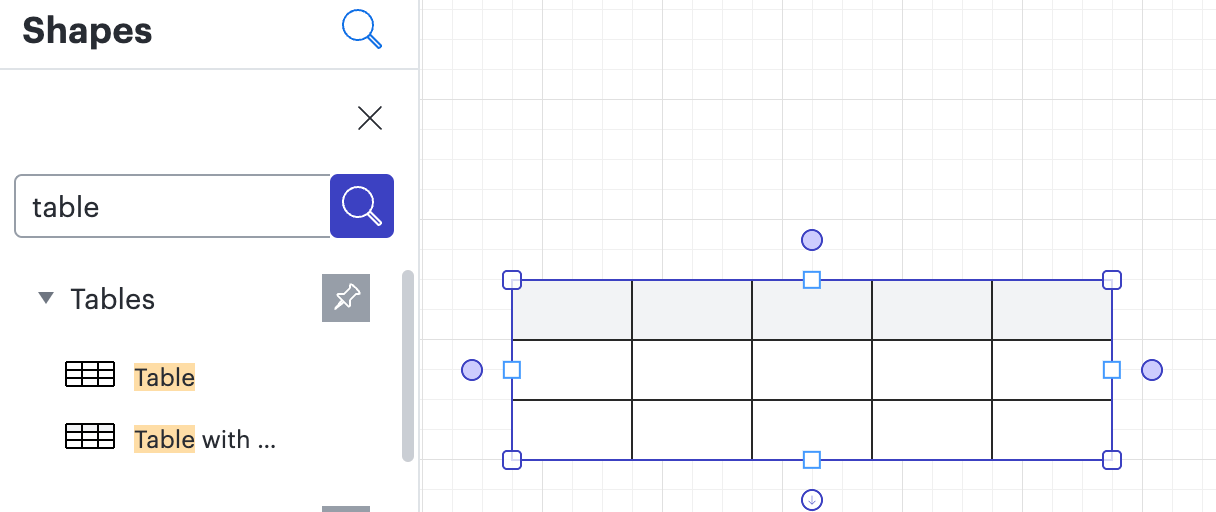
Thank you clarifying! You can create a table by searching in the Shapes Panel for your log page. Is this what you are looking for? Or is there another feature you are hoping to find?

Create an account in the community
A Lucid or airfocus account is required to interact with the Community, and your participation is subject to the Supplemental Lucid Community Terms. You may not participate in the Community if you are under 18. You will be redirected to the Lucid or airfocus app to log in.
Log in to the community
A Lucid or airfocus account is required to interact with the Community, and your participation is subject to the Supplemental Lucid Community Terms. You may not participate in the Community if you are under 18. You will be redirected to the Lucid or airfocus app to log in.
Log in with Lucid Log in with airfocus
or
Enter your E-mail address. We'll send you an e-mail with instructions to reset your password.