I have a custom field in a my Org Chart which I use to track whether a position is open or not (Open = Y). I'd like to add a field which looks at downstream objects and counts the occurrences of "Open = Y". This is similar to the built in "Head Count" field which is available on org charts out of the box but unfortunately I cannot see how that number is referenced in the chart please help.

Hi Eric

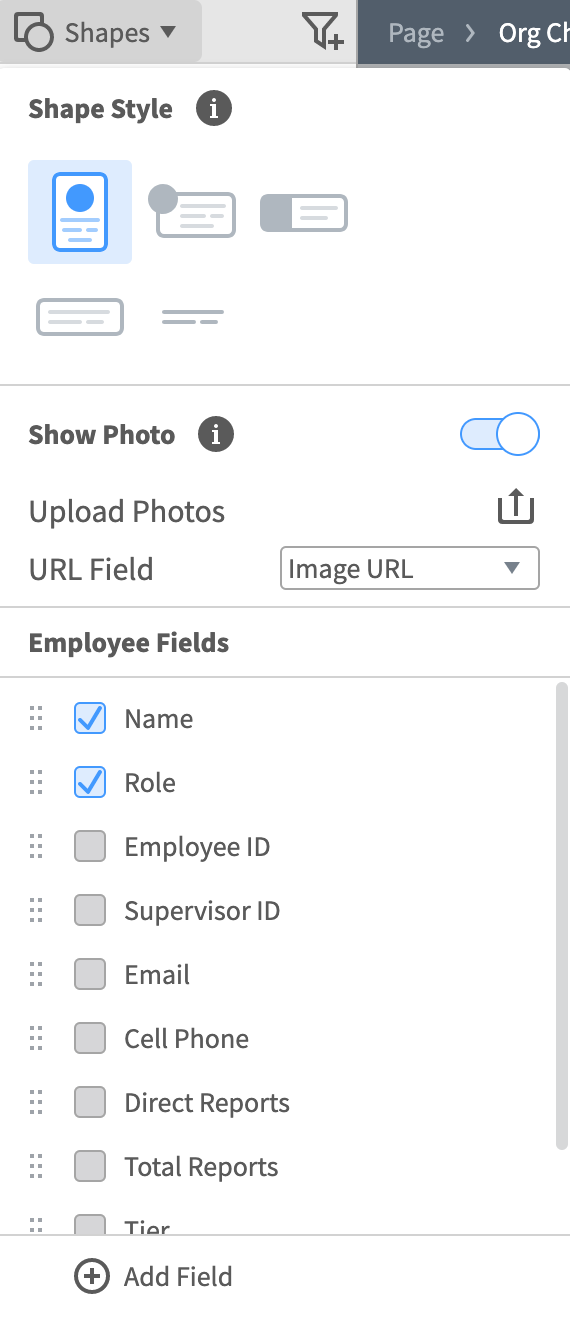
Thanks for posting in the community! You can count the number of boxes containing a certain attribute using the 'COUNT' function. To use this function create a new field and apply it to all shapes using the Globe icon.

kA7-yOQPtG0z8jUirniStg.png

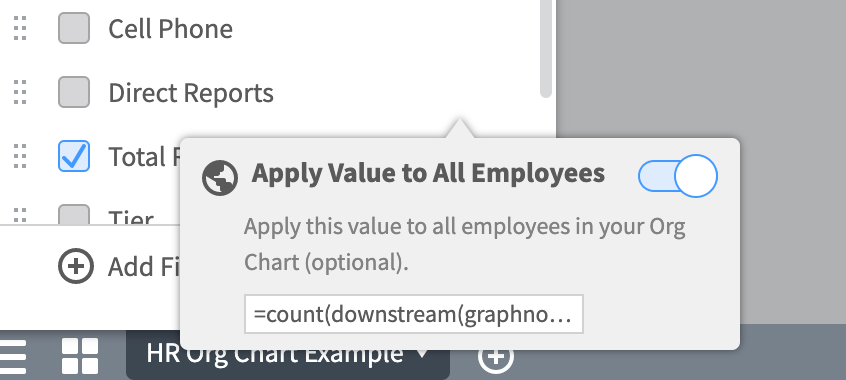
When you click the Globe icon you should see the following (with a blank 'Add Value here' field):NbvMbQXB3fOKWRu3ZPos9w.png

Using formulas you can set this field to show the number of open roles in a specific department or area. For help creating the correct formula please take a look at this article from the Lucidchart Help Center for instructions. Hope this helps! Let me know if you have any questions. 


The directions provided in the article linked don't seem to work properly for the Org Chart at least from my experience trying this a number of different ways.


Example there is a custom field added to my Org Chart named "Type" (intention to store values "Employee" or "Contractor")


I want to show a unique count of Employees (vs. Contractors).  I've tried a number of approaches and nothing works the most basic I would expect to work based on the linked article would have a formula such as:


=COUNTIF(children contains(THIS."Type" "Contractor")


I tried downstream vs. children


=COUNTIF(downstream contains(THIS."Type" "Contractor")


I also tried using FILTER to see if that would do anything


=count(FILTER(downstream contains(@'Type' 'Contractor'))


All is see is #ERROR! for that field on the Org Chart and I would expect this be simple - but I must be missing something.  Any advice here is appreciated


I answered my own question at least have something that is now working so wanted to share.  This formula works (and you can play w/ the downstream and downstreamdeep references)


=count(FILTER(downstreamdeep contains(@"Type" "Contractor")))


Certainly open to any other suggestions if there is a better/different/more efficient formula though!


I'm attempting to do the exact same thing and ran into the same problems.  THANK YOU for adding the formula!  One piece I'm still trying to figure out is when I collapse an org chart the count changes (based on what can be viewed on the page).  This is unlike Total Reports and Direct Reports built in formula that makes used of graphnode.  Does anyone know how to prevent the calculated value to not change when the orgs are collapsed and expanded?


Forgot to mention: When I have the entire org chart expanded the formula works.  But that's a bit difficult given I have over 600 employees in the org chart.


Hopefully this is a simple setting that I just can't find.


Thanks!


Hi Todd

Thanks for posting on the community! You can use graphnodes in your formula in order to calculate both open and collapsed Org charts. The following formula is an example of how you can use this:


=count(Filter(downstreamdeep(graphnodes) contains(@"Type" "Contractor")))


As a newbie to LucidChat having to use this workaround doesn't give me much confidence about the time it's going to take me to do other similar things. Is this a bug? Is it going to get fixed? Thanks


Hi Harry

Thanks for continuing this thread! This is not a workaround nor a bug but intended behavior. To learn more take a look at the Formulas article from the Lucidchart Help Center.

If you run into any issues and have questions please reach out again! I'm happy to help!


Hello. Sorry to re-hash an old thread however I have a unique question related to this exact scenario. I have found the last notes on using the "graphnodes" option very helpful for ensuring collapsed nodes show in the org count under custom fields within the org chart. The methods in this thread however appear to rely on adding a custom field inside of the org chart and displaying the data within the org chart boxes.


To make displaying my data counts more viewing friendly I am attempting to put a legend box within the page but outside of the org chart that shows each type of employee and various locations that are inside of my employee data. Within that legend box I am putting various formulas for each use case.  For example Contractor vs Employee. Or US location vs Other country locations etc.  I am then connecting that legend box through a connector. When taking this approach I only get numbers from top level org not the collapsed boxes. I assume this is because my legend lives outside of the Org box and the graphnodes reference is not valid. Is there method to allow me to get Org data populated by using a different formula? 


Hi Adam


Thank you for contributing to the Lucid Community! This is an excellent question and we will need to take a closer look at your document to better understand your issue. I've opened a support ticket for your request to enable you to privately share the document URL.

Please look for an email from Support@lucidchart.com in your inbox.


The solution from Clara works well for me. If I wanted to include a count for the current node as well as the downstream ones how could I do that?


John P the formulas support math operators. There may be a more elegant way to have the formula include the top level node but an easy workaround is to add a +1 to your formula. Here is an example where I am counting all people who have an office in the US and I wanted to include the person I connected to.


{{=count(Filter(downstreamdeep(graphnodes) contains(@"officename" "US")))+1}}


Also I wanted to post a solution to my previous question the support team here worked offline to help address my issue. In case you want to refer to the top node but do not want to have an arrow actually touching it in order for it to run these formulas....


  1. Create a custom field in which you will obtain the system id for the shape in your diagram. This is done by making a custom label field with a formula of "=LABEL(this)" without quotes. Once you add this field and then show it within your org shape in your diagram you will see its a very long cryptic name like "OSmebyP2zzj/ILNBzwWiitwggug="

  2. You can now use this label in the same way you did in the downstream nodes scenario.  Here is an example where I am using the label and then using another custom field to count the number of US employees. {{=#"OSmebyP2zzj/ILNBzwWiitwggug="."US"+1}}  You can see I am also using the +1 operator to get the similar result a previous poster was looking for where you want to include the top level connector.


Thanks Adam -- what if I need to count the current node only if it also matches the filter condition?


Hi @john p104


In order to count the current node only if it matches the filter condition consider the following example:


=IF(contains(@'Type' 'Contractor') 1 0) + count(Filter(downstreamdeep(graphnodes) contains(@'Type' 'Contractor')))


With this formula you can count the current node only if it meets the specified filter condition. You will likely need to customize it to your exact needs.


I also want to extend an invitation to any viewers of this thread to share any other tips tricks or formula innovations you come across. Your experiences and insights can greatly benefit the Lucid Community.


If you have more questions or need further assistance please don't hesitate to ask. Let's keep the collaboration going in this thread!


Hi! I’m Micah from Lucid’s community team. 👋 I thought you, and any others who might come across this topic in the future, might be interested in Lucid’s Data Trusted User Group. This group is made up of knowledgeable users who regularly analyze and visualize data in their work. As part of this group, you’ll have the opportunity to connect directly with Lucid’s product team, gain early access to beta features, and share insights about your needs, shaping the future of Lucid’s data solutions 🎉 You can learn more and request to join here. Thanks!


Reply