Hi Kenji Thanks for reaching out on Lucidchart Community! You can create Conditional Formatting rules to show these variations based on Location skills etc. To learn how to set up your Conditional Formatting on your document I suggest checking out our Conditional Formatting and Icon Sets article.
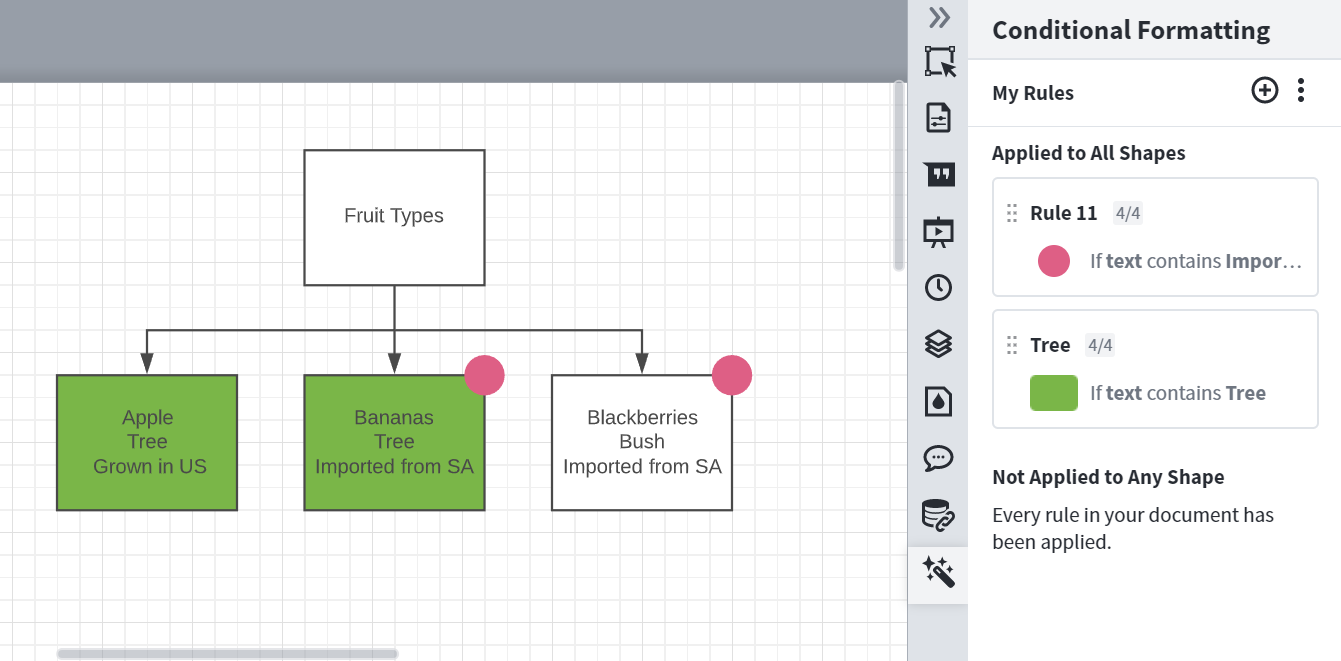
Just to provide a general example in this screenshot below I have created two Conditional Formatting rules for my data set. One is that if the text contains "Tree" the Shape Style>Fill Color is green. The other rule is that if the text contains "Imported from SA" there is a pink circle icon in the upper right corner of the shape. You can customize these as desired to represent your information.
Please let me know if you have any other specific questions after checking out the article and following the steps outlined there! Hope this helps!
Hi Shanna
Thanks for the reply. Yes conditional formatting would be good but perhaps where there is only a small number of shapes.
In your example screenshot if there were many more types of fruit I would like to be able to have a small summary table to the side. This could show the number of fruit "Grown in US" or "Imported from SA" Number of fruit grown on trees vs number grown on bushes.
Is it possible to do something like this by using a formula to automatically count the data contalned/linked to each shape?
Thanks!
Hi Kenji
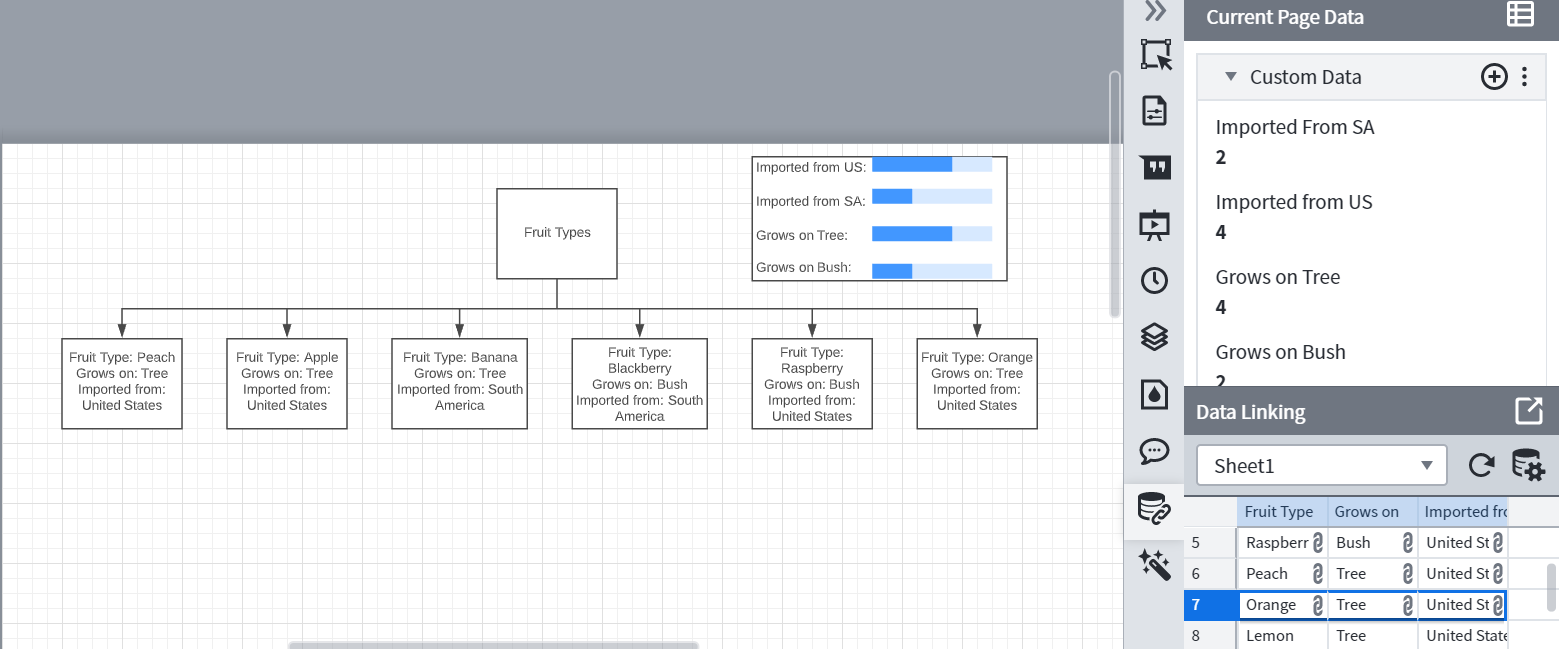
Thanks for following up and further explaining what you are looking to do! Yes you can use Formulas and Dynamic Shapes to make a summary table for a document. In the below example I have input custom data and then used variations of the following formula (edited for each specific condition) =COUNTIF(DESCENDANTS THIS."Grows on:" = 'Bush') to add up the numbers that fall under each category (as seen under Custom Data on the right of the below screenshot).
I then set up Dynamic Shapes and used variations of this formula =parent."Grows on Bush" to get the blue dynamic shapes that show out of 6 (total fruit types) how many fall under each of my four categories.
To learn more about using formulas and specific formulas to be used for different situations please check out our How to use Formulas article. Please let me know if you have any other specific questions as you go through this process. Hope this helps!
Thanks
This is exactly the type of thing I had in mind- but I fallen at the first hurdle!
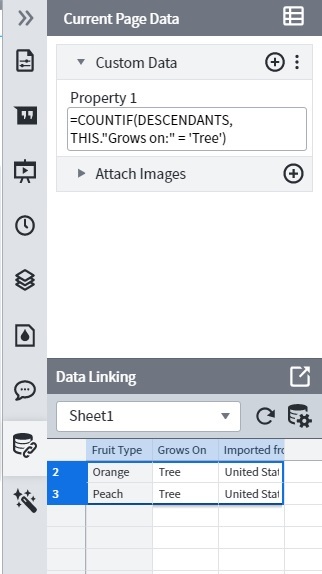
I have tried to replicate your data using just two records/rows and linked them to a Lucid chart file. Then I input the formula you used as per the attached screenshot but instead of getting the expected result '2' (ie two types of fruit growing on trees) the result I get is '0'.
Do you have an idea of where I am going wrong?
Thanks.
Hi Kenji
Thanks for following up! In these formulas capitalization is very important the text needs to be exact. It looks like your imported data says "Grows On" but the rule I used uses "Grows on:" (lowercase o). So I would change that so it matches it will be easier for you to do so in the formula. I would also try with and without the colon ":" to make sure it matches your datasheet exactly. Hope this helps!
Hi
I have changed the capitalisation to match and also tried the formula with and without the colon but I am still getting the same result.
Any ideas - can you maybe share with me your sample file?
Thanks for your help.
Hi Kenji
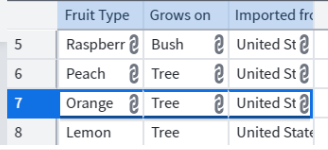
Just to clarify have you created a diagram with that custom data in your doc? You will need to create shapes and attach that data to them before the formula will work. It counts the information on the doc not from the custom data section. It looks like you haven't yet created a diagram with the shapes because when you do you will see little "links" next to the information that is linked to a shape. The easiest way to do this is to click on the numbers (for example 5 in the screenshot below) and drag it to the doc at which point it will allow you to select a shape and then it will attach the text (data) to that shape. Once you have added your two shapes that are associated with that associated data retry those tips with the formula and it should count it properly for you!
Hi Shanna
Thanks that solved it!!!
I had linked the data to the lucid chart file so did not think that I had to link the data to specific shapes for the formula to work.
But now all is working. thanks for persevering with me!
I can now progress with my work.
Kenji
PS: Formula worked without the colon mark.
Hi Kenji Thanks for following up and letting me know that worked! Happy Charting!
Hi @Kenji U! I’m Abby from Lucid, reaching out because I think you, and others who might come across this topic in the future, might be interested in Lucid’s Data Trusted User Group. This group is made up of knowledgeable users who regularly analyze and visualize data in their work. As part of this group, you’ll have the opportunity to connect directly with Lucid’s product team, gain early access to beta features, and share insights about your needs, shaping the future of Lucid’s data solutions 🎉 You can learn more and request to join here. Thanks!