Hi Folks
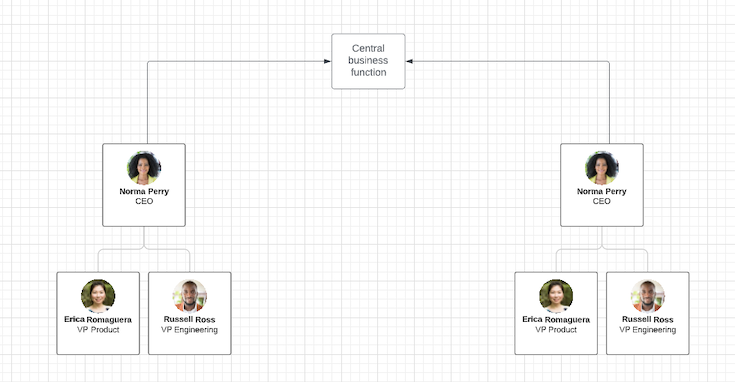
Our business has two core areas and a central business function that services both. Therefore they have a dotted line to both sides of the company. I wondered if anyone could share how best to demonstrate this structure?
Central Business Functions on org chart

Create an account in the community
A Lucid or airfocus account is required to interact with the Community, and your participation is subject to the Supplemental Lucid Community Terms. You may not participate in the Community if you are under 18. You will be redirected to the Lucid or airfocus app to log in.
Log in to the community
A Lucid or airfocus account is required to interact with the Community, and your participation is subject to the Supplemental Lucid Community Terms. You may not participate in the Community if you are under 18. You will be redirected to the Lucid or airfocus app to log in.
Log in with Lucid Log in with airfocus
or
Enter your E-mail address. We'll send you an e-mail with instructions to reset your password.