Semi urgent ask: I setup an org chart using Lucid. I have name and title. I want to add location and levels but I have tons of questions around this. I was wondering if someone could help me by hopping on a call and showing me? I’m confused on the conditional formatting and how to input everyone’s level individually. I also need to learn how to do group view after. I know how to get it but it’s not doing what I want it to do. I wish Lucid has a customer service line...
Hi @kpisano1, thanks for this post! Lucid doesn’t offer phone support, but I’m happy to help you via this thread and demonstrate a few things here.
By “adding location and levels,” do you mean that you want to include these elements on each individual employee tile? If so, you’ll need to include these elements in your org chart data. If uploading a data set, you can simply include this as a column in your data source. If you’re creating it manually, you can add it as a custom data field via the Layout tab of the org chart panel on the right of the editor.
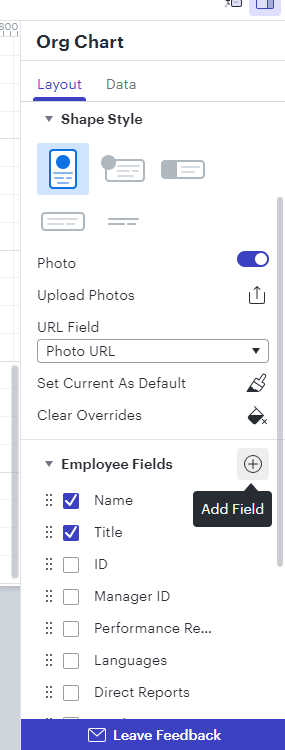
Then, to display this information on your employee shapes, navigate to the Layout tab of the org chart panel, open the Employee Fields section, and click the checkbox next to the fields.
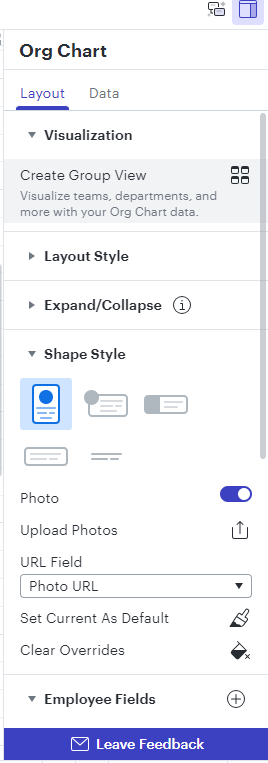
Regarding Group View, you can automatically create one by expanding the Visualization option of the Org Chart panel and clicking “Create Group View.” To access this menu, please note that you’ll need to select the outline of the whole org chart rather than an individual employee shape.
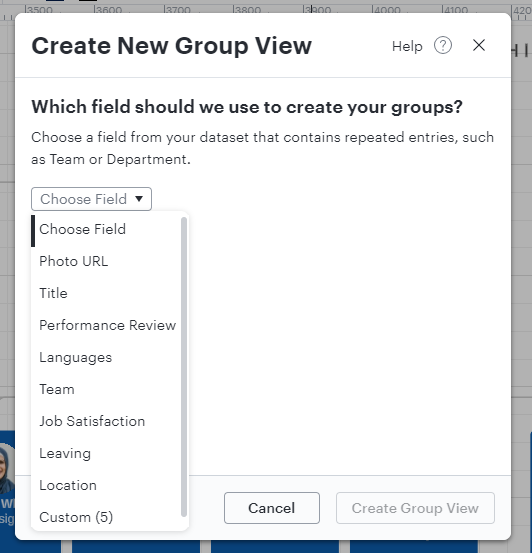
From there, you can choose the field by which you want to group your employees.
This creates the group view on a new page in your document.
Finally, I also recommend this Org Charts article from the Lucid Help Center for a detailed walk-through of these features.
Hi @kpisano1, thanks for this post! Lucid doesn’t offer phone support, but I’m happy to help you via this thread and demonstrate a few things here.
By “adding location and levels,” do you mean that you want to include these elements on each individual employee tile? If so, you’ll need to include these elements in your org chart data. If uploading a data set, you can simply include this as a column in your data source. If you’re creating it manually, you can add it as a custom data field via the Layout tab of the org chart panel on the right of the editor.
Then, to display this information on your employee shapes, navigate to the Layout tab of the org chart panel, open the Employee Fields section, and click the checkbox next to the fields.
Regarding Group View, you can automatically create one by expanding the Visualization option of the Org Chart panel and clicking “Create Group View.” To access this menu, please note that you’ll need to select the outline of the whole org chart rather than an individual employee shape.
From there, you can choose the field by which you want to group your employees.
This creates the group view on a new page in your document.
Finally, I also recommend this Org Charts article from the Lucid Help Center for a detailed walk-through of these features.
Regarding conditional formatting, can you clarify what you’re hoping to accomplish using it? If you have an example or screenshot to share, that would be very helpful! Thank you.
A Lucid or airfocus account is required to interact with the Community, and your participation is subject to the
Supplemental Lucid Community Terms.
You may not participate in the Community if you are under 18. You will be redirected to the Lucid or airfocus app to log in.
A Lucid or airfocus account is required to interact with the Community, and your participation is subject to the
Supplemental Lucid Community Terms.
You may not participate in the Community if you are under 18. You will be redirected to the Lucid or airfocus app to log in.