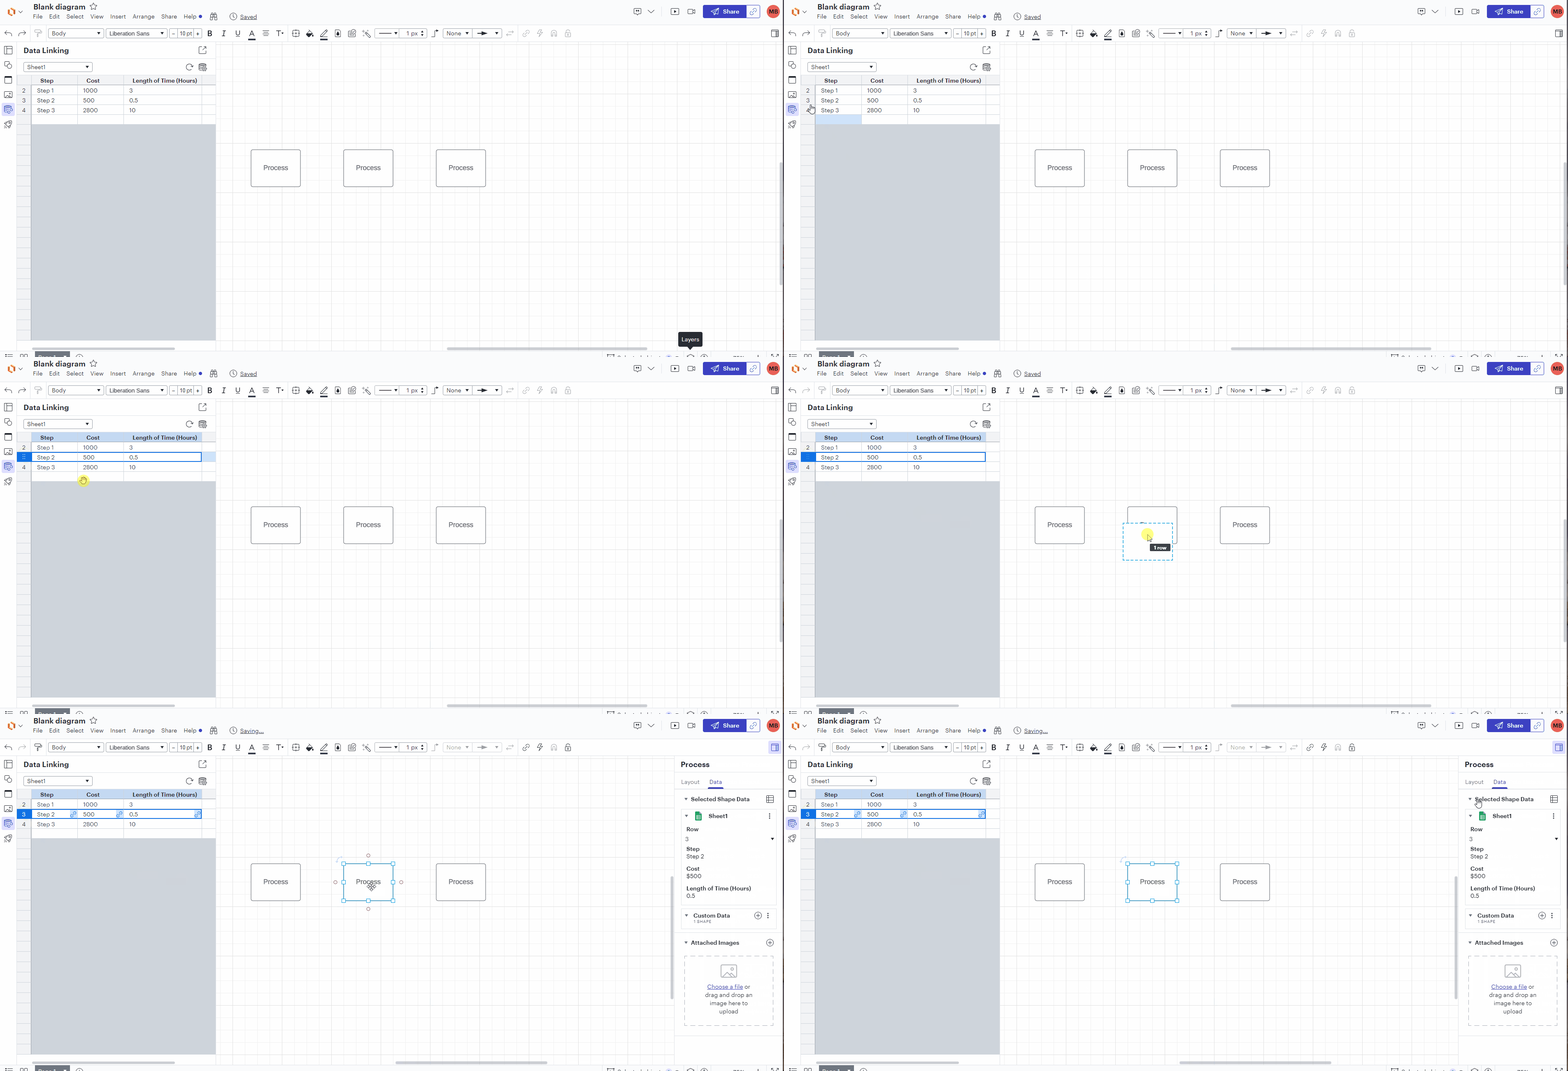
Hi thanks for posting in the community! Overall I believe what you're describing is possible in Lucidchart. Using Data Linking you can upload a dataset containing information like cost and length of time then associate that data with shapes on your canvas. I've demonstrated this below with a basic example.
However because the combination of data and visual elements are infinite Lucidchart cannot perform the association of data to a shape automatically and you'll need do so manually. Then to sum the cost and duration of a process' elements you can then use formulas to add these values. Our full formulas documentation can be found here and you might also find this example from another user to be helpful. (Note that in the example we describe creating a custom "Time" data field - this wouldn't be necessary if you've imported your data with that field and associated it with a shape.)
I hope this helps! Please let me know if you have additional questions.