Question

AI-generated flowchart using CSV data in Lucidchart

  • January 12, 2026
  • 2 replies
  • 49 views

john.a.lopez
Forum|alt.badge.img+11

I am ingesting process sequence data from a CSV file into a Lucid AI prompt as the data source.
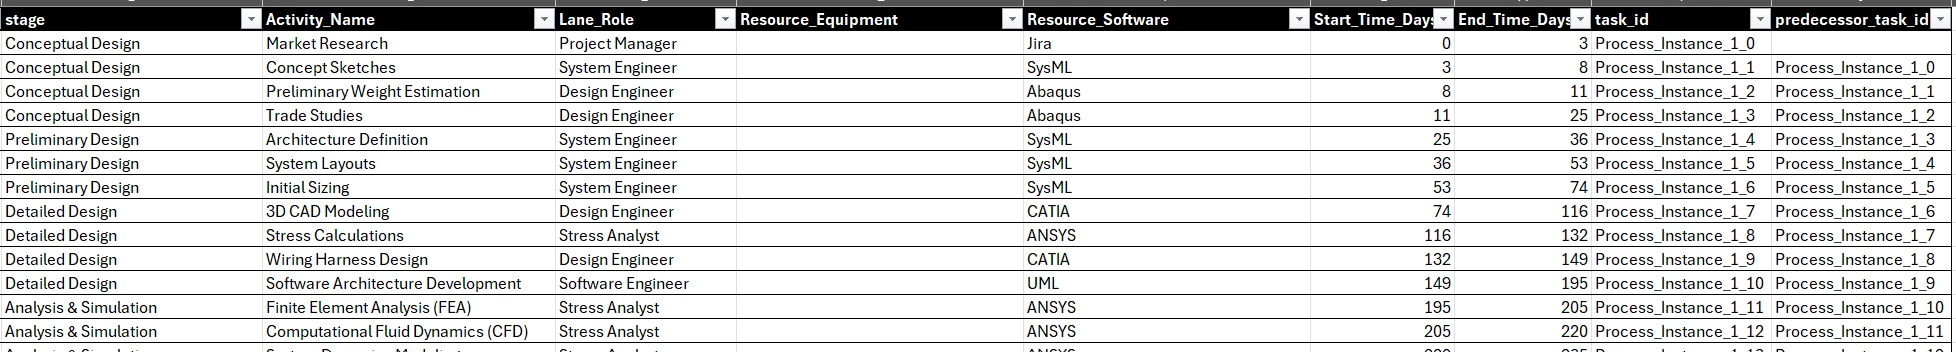
Schema sample of the data is as follows:

The prompt to create the flowchart is:
 

create page BPMN01
create a flowchart using the attached data in BPMN01.csv on page BPMN01
pool = Aerospace Process
swimlane = Lane_Role
The following columns in the data are to map to flowchart objects as:
Shape Library = Flowchart
Page ID = BPMN01
ID = task_id
Name = Process
Text Area 1 = Activity_Name
Custom Data Field: Software = Resource_Software
Custom Data Field: Equipment = Resource_Equipment
Custom Data Field: Role = Lane_Role
Custom Data Field: Start = Start_Time_Days
Custom Data Field: End = End_Time_Days
Flowchart Sequence:
from = predecessor_task_id
to = task_id
Name = Line
Line Source = predecessor_task_id
Line Destination = task_id
Source Arrow = None
Destination Arrow = Arrow
 

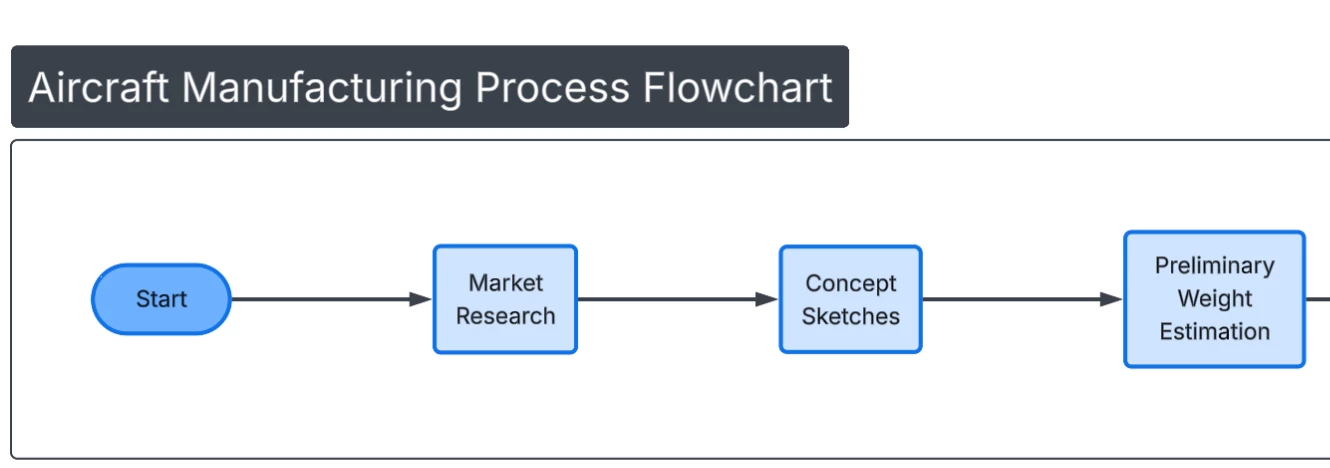
it does produce something of a flowchart:
 

example flow chart

but does not include:

  • any custom metadata like: Software = Resource_Software
  • does not create the pool = Aerospace Process
  • swimlane = column Lane_Role

Please advise on proper attribute mapping so that the above will create:

  • flowchart process objects in the pool/swimlane as specified
  • each flowchart process object will have the additional custom metadata as specified in the prompt
  • how to create with custom flowchart shape objects that would have additional metadata displayed on the object such as: Resource_Software

Thank you

Comments

Forum|alt.badge.img+1
  • Lucid product team
  • January 14, 2026

Hi, ​@john.a.lopez


It looks like part of what you’re asking can be accomplished via Lucid AI, but I want to clarify a few things about Lucid AI’s current capabilities.

Lucid AI does not create or attach hidden data or custom metadata to shapes. It generates: what is visible on the canvas, including

  • the diagram type
  • swimlanes (if relevant to diagram type)
  • the shapes
  • their layout and relationships
  • and the visible text on those shapes


When you upload a CSV to Lucid AI, the AI uses it as context, not as a structured data source. That means instructions like “Custom Data Field: Software = Resource_Software” won’t be applied as actual data bindings. Information such as Resource_Software or Resource_Equipment can only be generated as visible text on the shape (for example, as a second line in the task label).


Additionally, it looks like you’re using a Flowchart library mapping, but requesting BPMN-specific constructs (pool + swimlanes). Pools/lanes generally require the BPMN shape set; if the diagram is being generated as a standard flowchart, the AI will often ignore pool/lane instructions.


In short:

  • Lucid AI can use CSV data to decide what to generate and what text to show
  • It cannot store or manage CSV fields as underlying shape data
  • If your goal is to visually show software, equipment, or roles, the best approach is to explicitly ask the AI to include those fields as visible text on each task

You can still have linked metadata to shapes in Lucidchart; it it just not yet supported via Lucid AI. If you would still like to have the metadata linked, here is a helpful article and course on how to do that: https://www.lucidchart.com/blog/make-your-diagrams-dynamic-with-data-linking.


john.a.lopez
Forum|alt.badge.img+11
  • Author
  • January 14, 2026

@eliese - thanks for your reply. Yes i am aware (and we use it a lot) applying data-source rows as metadata to objects as custom data. Had hoped AI would do that for me. I also attached the CSV as a data source and tried to generate from there, but no luck. Yes, the desire would be to create a BPMN but AI only supports a flowchart so i was hoping to “get it to work” with pools/swimlanes. Thanks for the clarification. I am trying to create a pipeline actually … where i am currently using 100’s of instances of process data (gen’d synthetic from python) to simulate process mining, run that through statistical aggregation (in XLS) to get mean data in a singular process definition, then generate a diagram from that. I also tried creating Mermaid code with some limited success as well. The metrics (in the metadata) are important for the analysis.

Thanks again