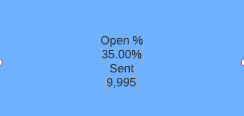
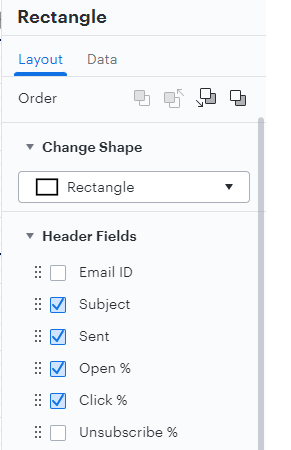
... apologies. Solved.
I still cannot figure out how I manage at times to drag the data to display directly into the shape. But at least I now know how to add linked column header and row values that will show together. I did not know to use the Layout window in the contextual menu!
Hi Leon
Thanks for contributing to the Lucid Community! Just to make sure that we are on the same page please review our
data linking article from the Lucidchart Help Center and let me know if you have any questions about the intended functionality. Please also review this
helpful example of Data Linking for a demonstration of the feature in action.To directly answer your question I've pasted the section on displaying data on document components below:
Display Data on Document Components
Lucidchart allows you to customize how the data you assign to shapes appears on the canvas.
To display a data label or value on an object follow these steps:
- Select the object on your canvas.
- Open the contextual panel by selecting the contextual panel icon on the far right-hand side of the toolbar.
- Hover over the desired row of data in the top half of the contextual panel.
- Click the Add Text button that appears.
The data label or value will appear as regular text that you can style and embed in longer text strings. If you replace the data linked to an object with a new row or cell of data the new data will automatically take on the format and style of the old data.
I hope this helps. Please let me know if you have any additional questions!