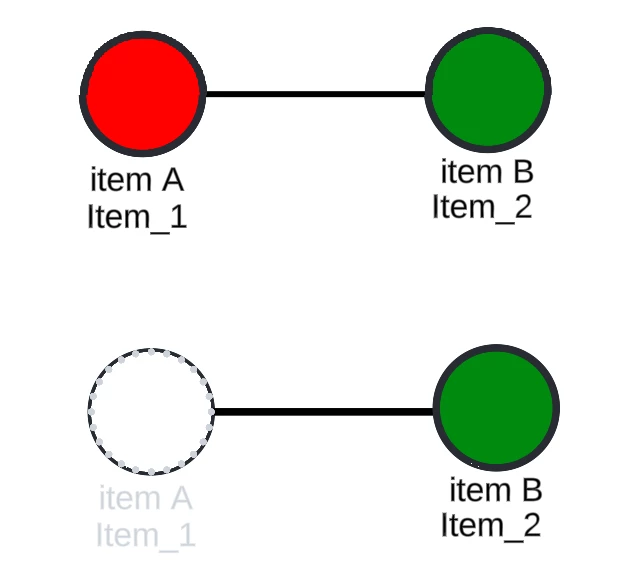
Hi, provided an illustration for reference. I am developing a diagram that has objects that has data linking. It is constantly changing, so there are times where I need to delete an item in my google sheets (source of data linking) so that it wouldn’t appear in my appsheet. However, when I do this in Lucidchart the assignment of ID for the succeeding object is changed. For example, using the diagram above I have two items A and B. Item A gets deleted in the lucidchart and in the google sheets (the blank row is maintained). Any suggestions to avoid this as I have numerous objects to maintain in my Lucidchart document and reassigning their data or data linking seems tedious.
Edit: I don’t usually delete the blank row because I have a separate sheet that has formulas based on the result of the value of those specific rows.
Best answer by Ria S
Hi @afc
Thanks for providing the illustration. It was helpful in understanding the issue.
You are absolutely right! When using data linking from Google Sheets in Lucidchart, deleting a row (even if it appears blank) can affect the indexing and ID assignment of the objects tied to that dataset. This happens because Lucidchart maintains a dynamic connection and will re-map the object bindings based on the current row order, and not the static cell IDs.
To help maintain stable object mapping, you can try these:
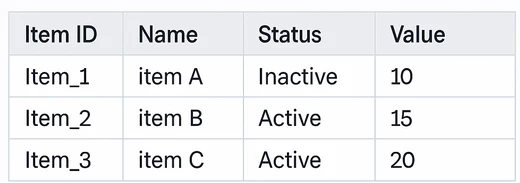
Avoid deleting rows in the source Google Sheet. Instead, consider marking them as "inactive" (e.g., use a status column with a value like "Archived" or "Do Not Display"), and then filter them out using the Linked Data filter within Lucidchart. This preserves the row's position and prevents reindexing. I included an example below:
Use a Unique Identifier column. Ensure each object has a persistent ID field (e.g., Item_001, Item_002), and in Lucidchart, link objects by this ID rather than by row order. This helps maintain the link even if rows are added, hidden, or filtered.
Maintain a static range in Google Sheets for Lucidchart linking. You could create a helper sheet that uses formulas (like FILTER, QUERY, or ARRAYFORMULA) to pull only active rows into a defined range (e.g., A1:E50) that never shifts, even when items are "removed" in the main sheet.
If you often need to "hide" objects (like in your image where Item A becomes white and semi-transparent), you could use Lucidchart layers or conditional formatting (based on data values) to visually hide inactive elements without deleting them.
While it may be tedious to re-link many objects, especially when maintaining diagrams over time, these methods have helped me manage my dynamic data sources more efficiently in Lucidchart.
Thanks for providing the illustration. It was helpful in understanding the issue.
You are absolutely right! When using data linking from Google Sheets in Lucidchart, deleting a row (even if it appears blank) can affect the indexing and ID assignment of the objects tied to that dataset. This happens because Lucidchart maintains a dynamic connection and will re-map the object bindings based on the current row order, and not the static cell IDs.
To help maintain stable object mapping, you can try these:
Avoid deleting rows in the source Google Sheet. Instead, consider marking them as "inactive" (e.g., use a status column with a value like "Archived" or "Do Not Display"), and then filter them out using the Linked Data filter within Lucidchart. This preserves the row's position and prevents reindexing. I included an example below:
Use a Unique Identifier column. Ensure each object has a persistent ID field (e.g., Item_001, Item_002), and in Lucidchart, link objects by this ID rather than by row order. This helps maintain the link even if rows are added, hidden, or filtered.
Maintain a static range in Google Sheets for Lucidchart linking. You could create a helper sheet that uses formulas (like FILTER, QUERY, or ARRAYFORMULA) to pull only active rows into a defined range (e.g., A1:E50) that never shifts, even when items are "removed" in the main sheet.
If you often need to "hide" objects (like in your image where Item A becomes white and semi-transparent), you could use Lucidchart layers or conditional formatting (based on data values) to visually hide inactive elements without deleting them.
While it may be tedious to re-link many objects, especially when maintaining diagrams over time, these methods have helped me manage my dynamic data sources more efficiently in Lucidchart.
A Lucid or airfocus account is required to interact with the Community, and your participation is subject to the
Supplemental Lucid Community Terms.
You may not participate in the Community if you are under 18. You will be redirected to the Lucid or airfocus app to log in.
A Lucid or airfocus account is required to interact with the Community, and your participation is subject to the
Supplemental Lucid Community Terms.
You may not participate in the Community if you are under 18. You will be redirected to the Lucid or airfocus app to log in.