Lucidchart supports a variety of diagram types when using Mermaid for diagramming as code. This post outlines the basic syntax for creating supported diagrams with Mermaid in Lucidchart.
Flowchart
Create clear and easy-to-understand flowcharts to represent complex systems and processes. The following code provides a framework for implementing a flowchart using Mermaid syntax in Lucidchart.
Code:
---
title: Chart Title
---
flowchart LR
A[Start] --> B[Step 1]
B --> C[Step 2]
C --> D{Decision Point}
D -- Option 1 --> E[Step 3A]
D -- Option 2 --> F[Step 3B]
E --> G[Step 4A]
F --> H[Step 4B]
G --> I[Next Step or End]
H --> I
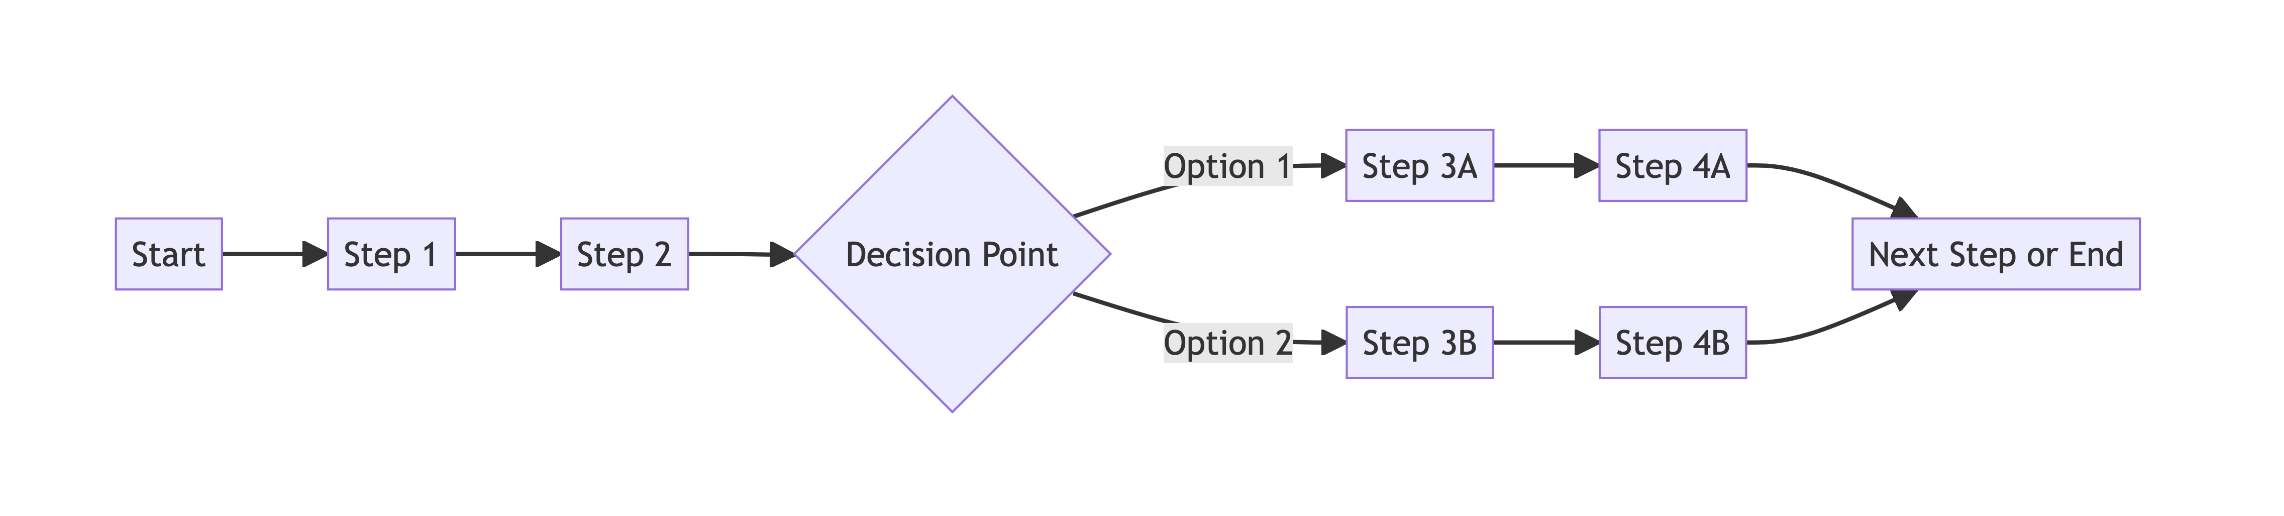
This code represents a basic flowchart structure where each step or decision point is clearly defined. Use ‘LR’ for left-to-right flowcharts. Use ‘TD’ for top-to-bottom flowcharts. For more advanced flowchart styling options, check out Mermaid’s Flowchart Basic Syntax guide.
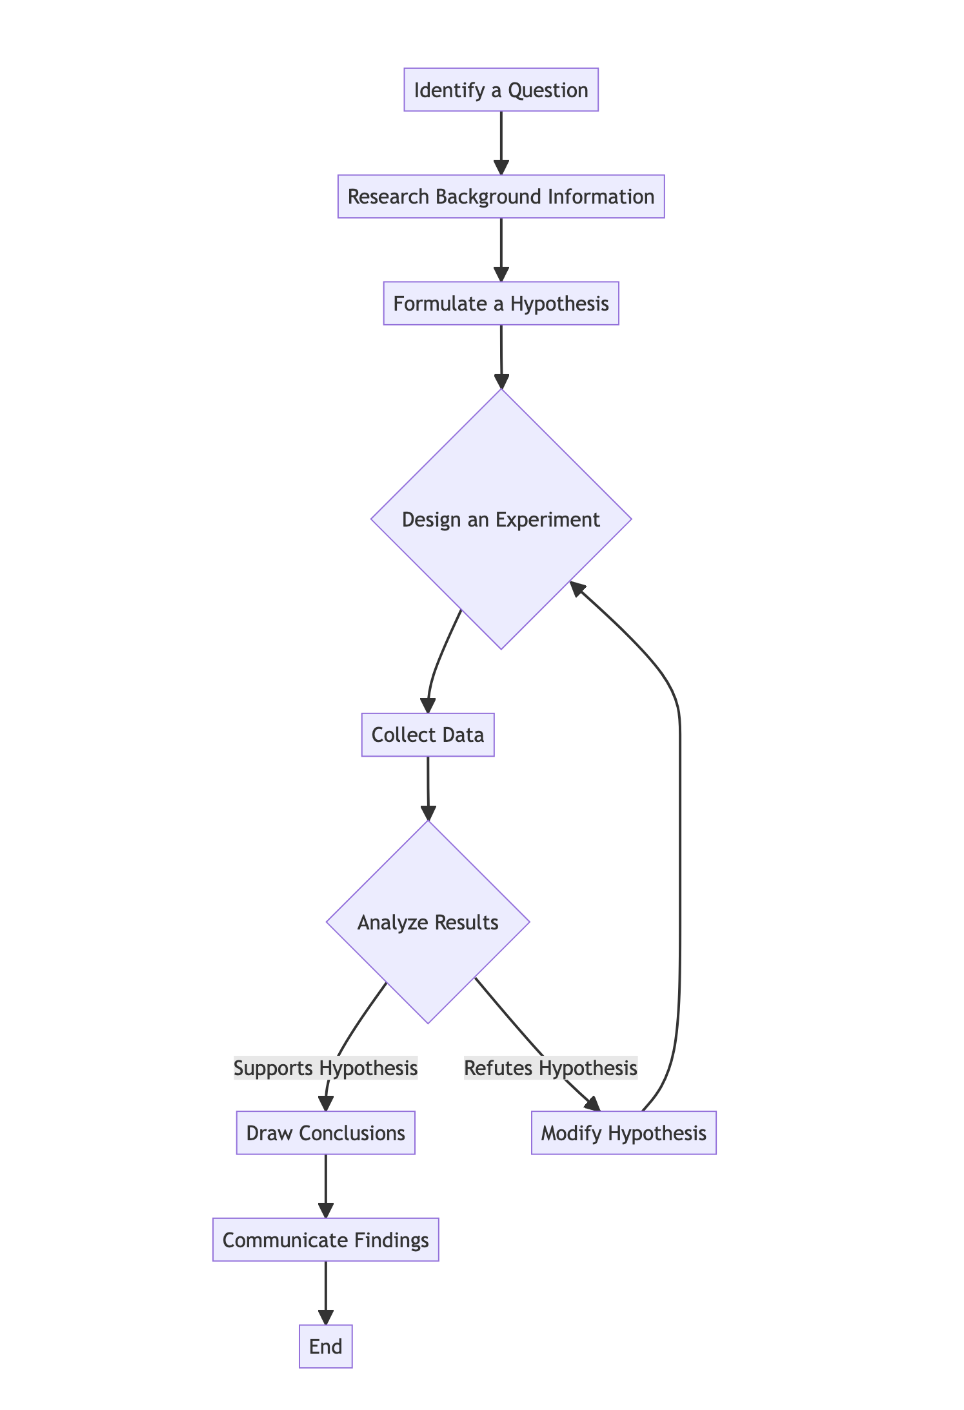
The example below utilizes Mermaid code to visualize the scientific method through a flowchart.
Sequence Diagrams
Sequence diagrams are used to represent processes and objects that operate together, and the interactions exchanged between them to perform a function. The following code provides a framework for implementing a sequence diagram using Mermaid syntax in Lucidchart.
Code:
sequenceDiagram
participant P1 as Participant 1
participant P2 as Participant 2
participant P3 as Participant 3
P1->>P2: Action 1
P2->>P3: Action 2
P3->>P2: Response 1
P2->>P1: Final Update
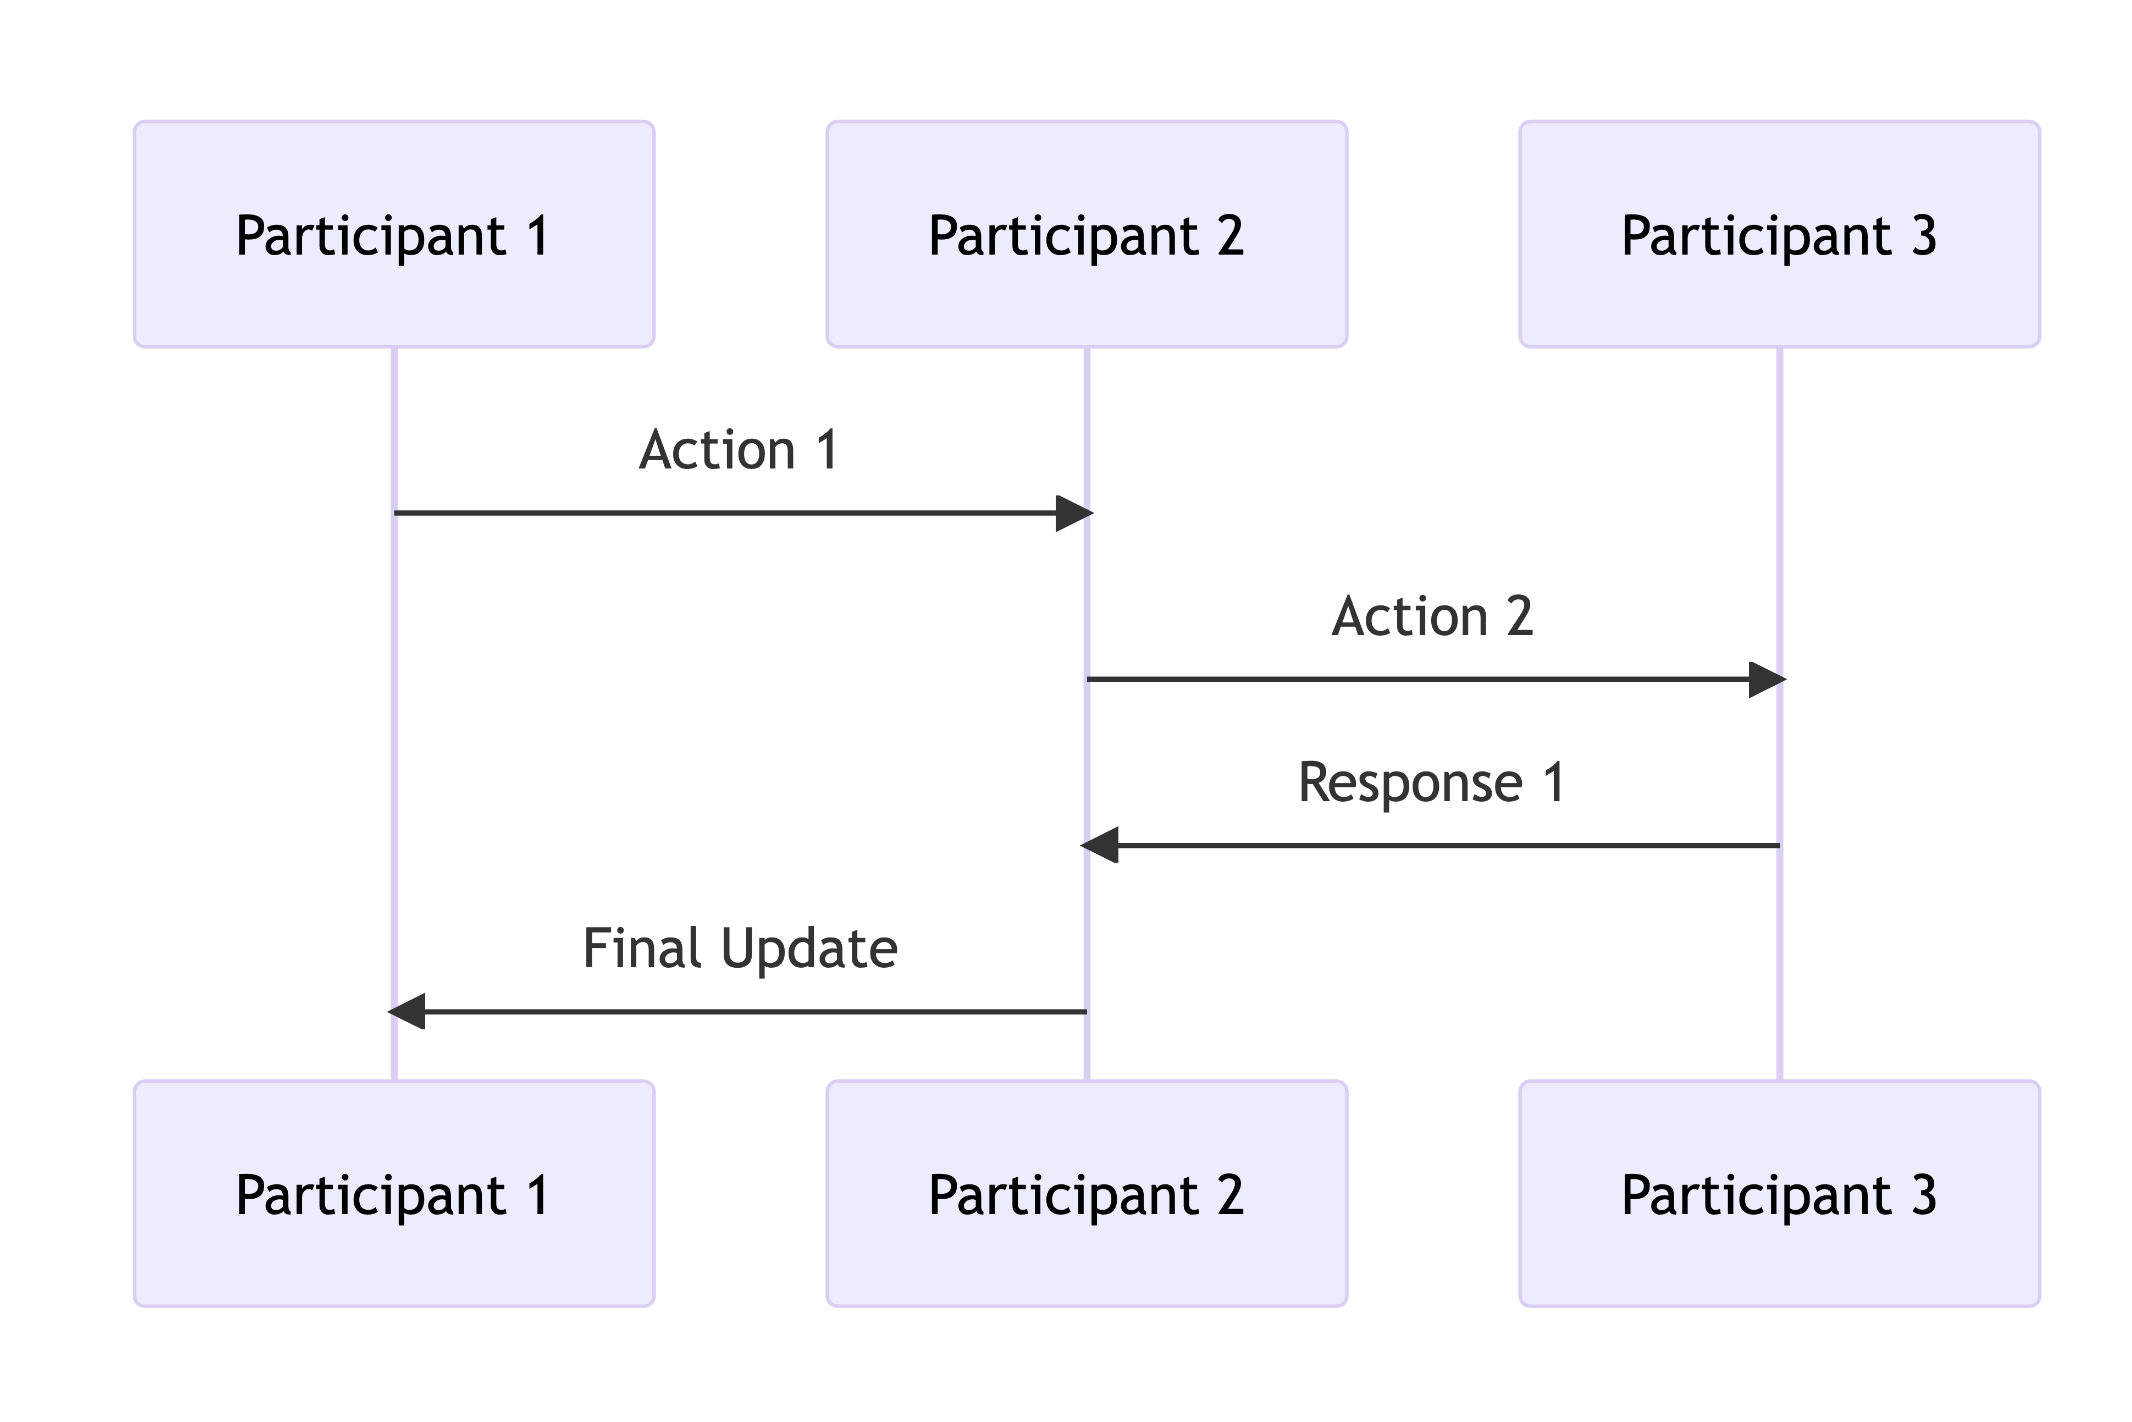
The above figure outlines basic sequence diagram structure in Mermaid, illustrating interactions between participants through a series of actions and responses. For more advanced Sequence Diagram syntax and styling options, check out Mermaid’s Sequence Diagrams guide.
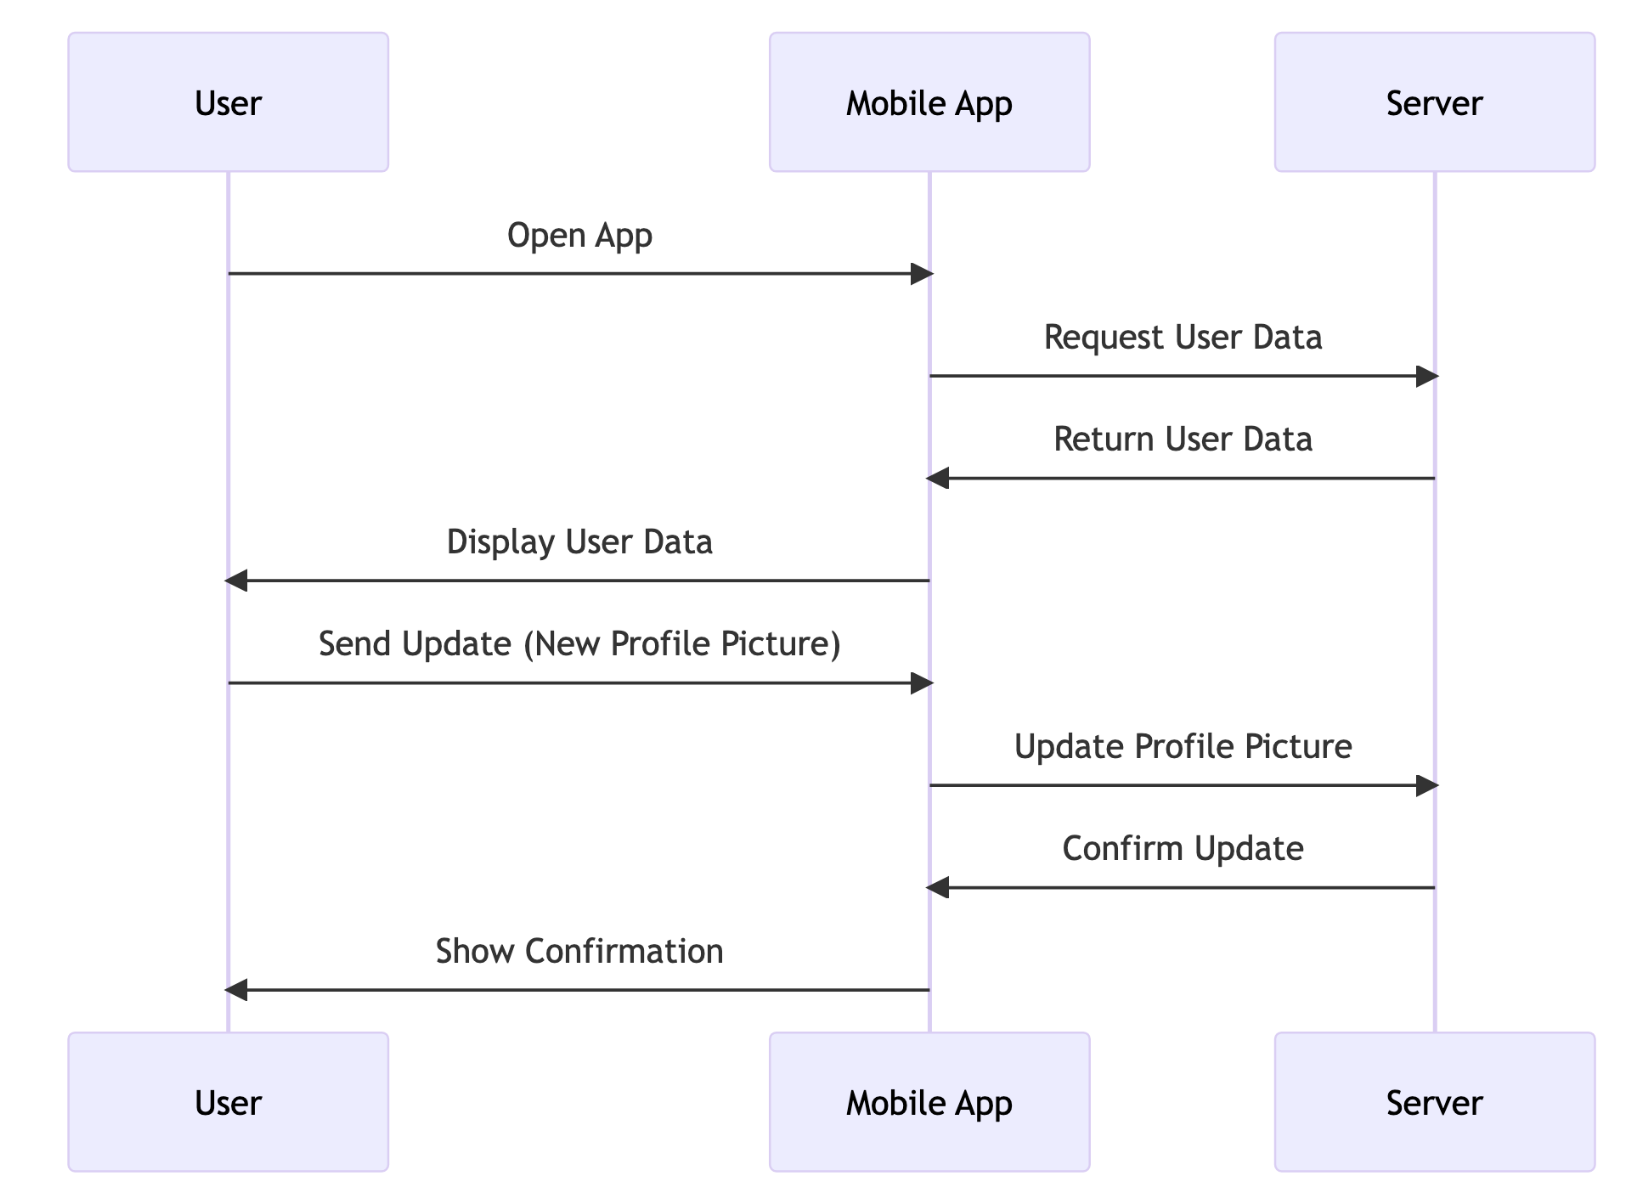
The example below uses a sequence diagram to represent a data exchange process between a user, a client application, and a server.
Class
Class diagrams map out the structure of a particular system by modeling its classes, attributes, operations, and relationships between objects. The following code provides a framework for implementing a class diagram using Mermaid syntax in Lucidchart.
Code:
---
title: Diagram Title
---
classDiagram
    class ClassA {
        +Attribute1
        +Attribute2
        +Method1()
        +Method2()
    }


    class ClassB {
        +Attribute1
        +Method1()
    }


    class ClassC {
        +Attribute1
        +Attribute2
        +Method1()
    }


    ClassA -- ClassB: Relation1
    ClassB -- ClassC: Relation2
    ClassC -- ClassA: Relation3
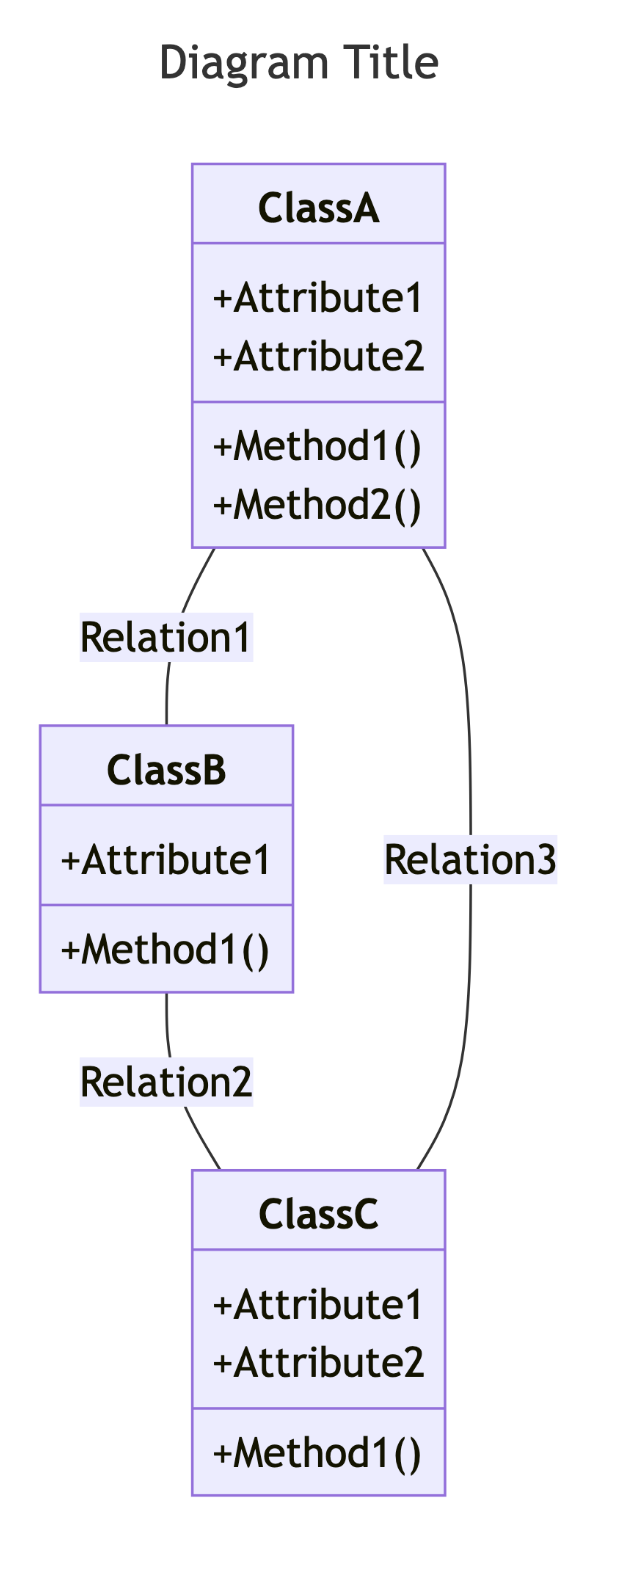
The above figure defines a basic class diagram structure in Mermaid, showcasing three classes with attributes and methods, along with their relationships. For more advanced Class Diagram syntax and customization options, check out Mermaid’s Class diagrams guide.
The example below uses a class diagram to model structures and interactions in an e-commerce system, including a customer and their cart, order, product and payment.

State
State diagrams are a behavioral diagram that shows transitions between various objects or systems. The following code provides a framework for implementing a state diagram using Mermaid syntax in Lucidchart.
Code:
stateDiagram-v2
[*] --> State1
State1 --> State2: Transition A
State2 --> State3: Transition B
State3 --> State4: Transition C
State4 --> State5: Transition D
State5 --> [*]
State2 --> State6: Alternate Path
State6 --> State4: Rejoin Main Flow
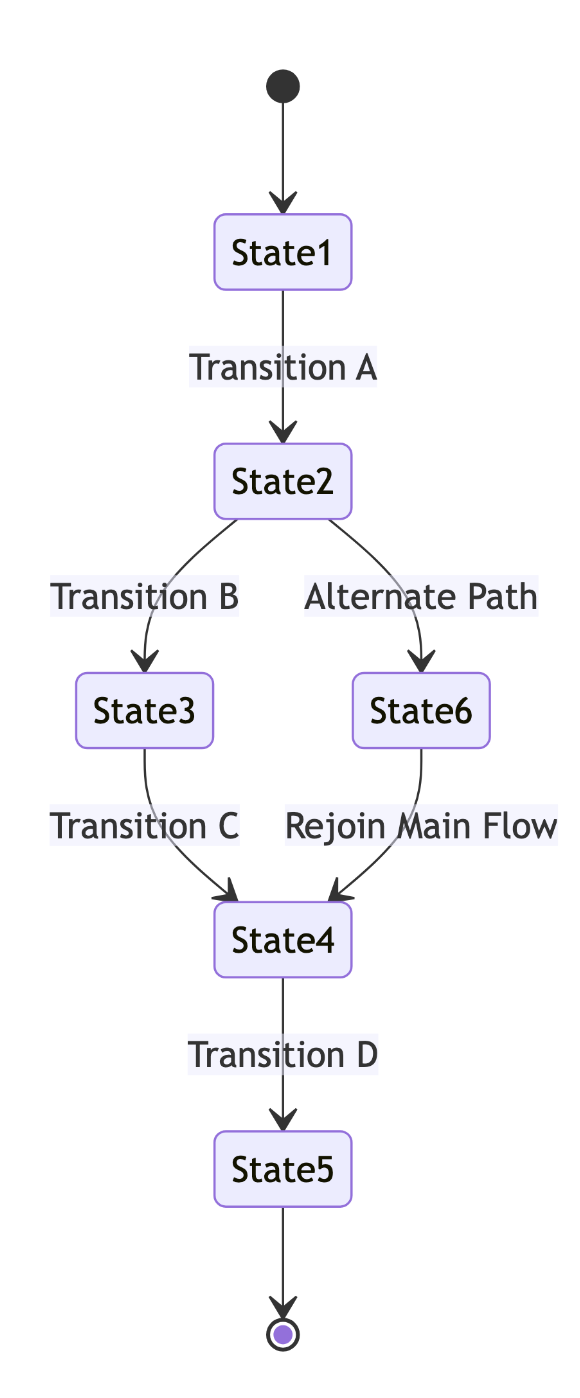
The above figure represents a basic state diagram in Mermaid, mapping out transitions between states from start to finish, including alternate paths. For more advanced State diagram syntax and styling options, refer to Mermaid’s State diagrams documentation.
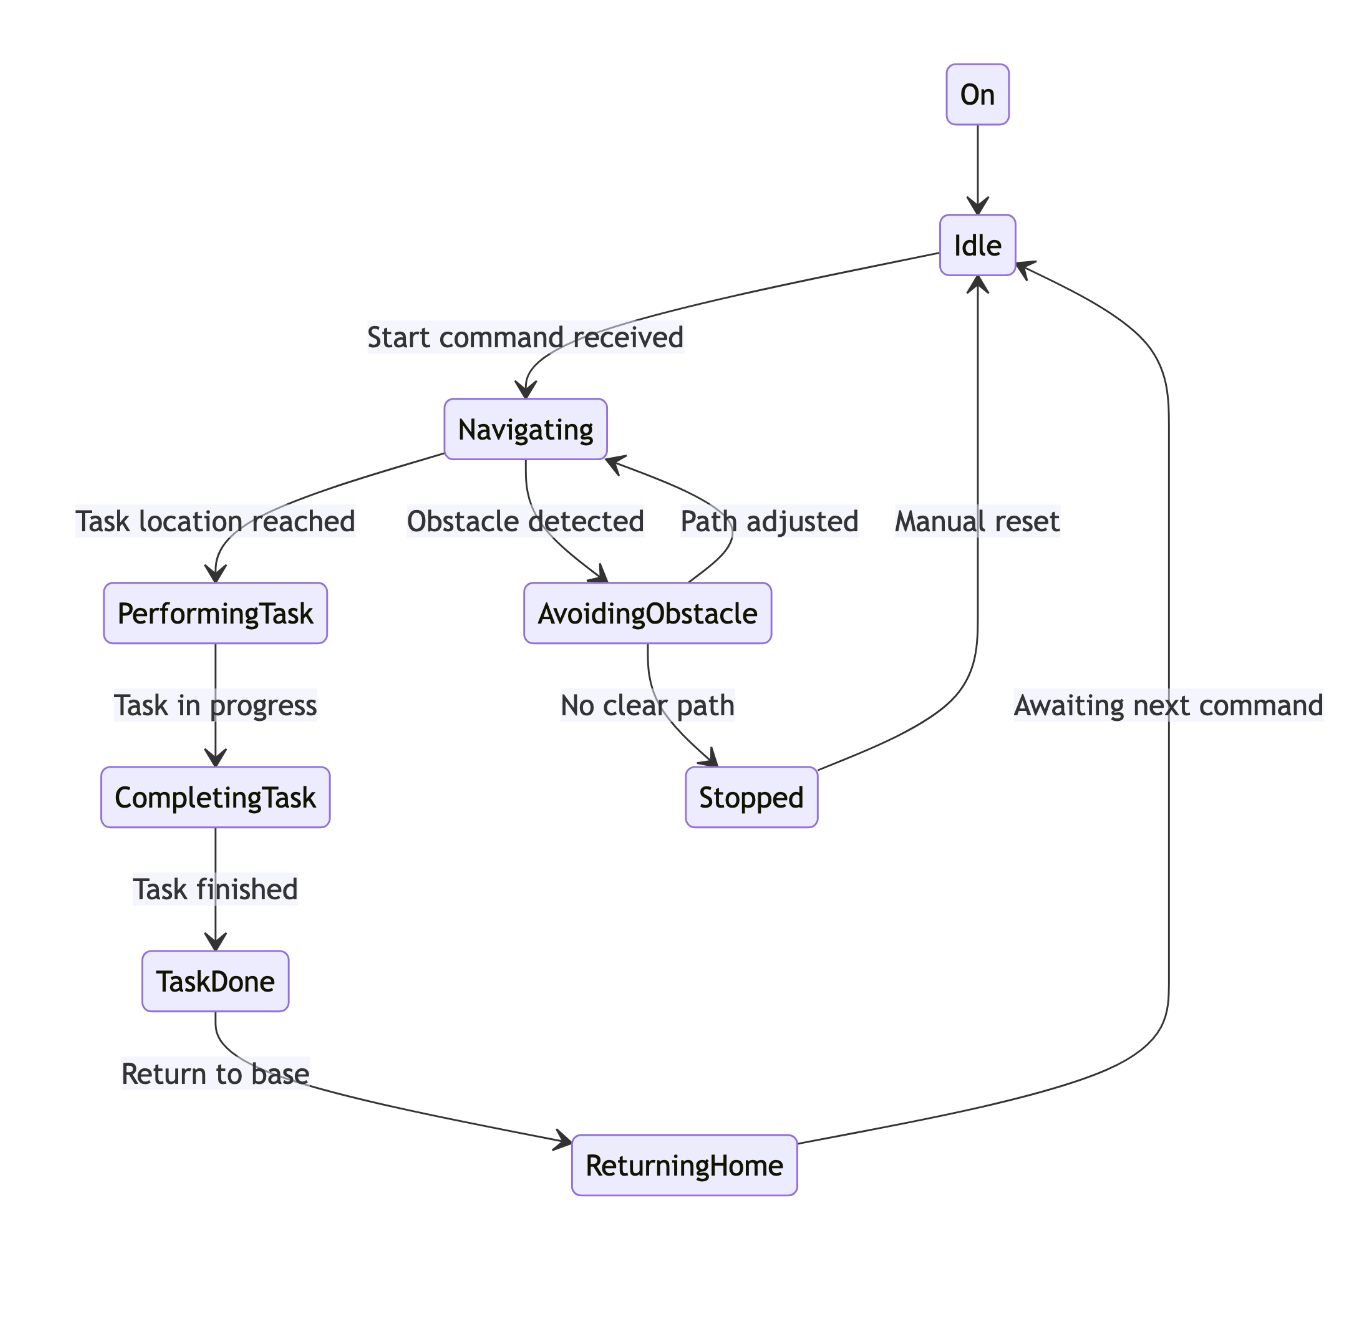
The example below uses a state diagram to show a robot’s movement and task execution, including navigation, obstacle avoidance, and task completion.
C4
C4 diagrams leverage the four levels of models (context, containers, components, and code) depending on your audience. C4 diagrams in Mermaid are currently experimental and may change with future releases. As a result, this diagram may have limited support. The following code provides a framework for implementing a C4 diagram using Mermaid syntax in Lucidchart.
Code:
C4Context
title Diagram Title
Person(actor, "Actor", "Interacts with the system")
System(systemA, "System A", "Processes requests")
SystemDb(systemB, "System B", "Stores data")
Rel(actor, systemA, "Uses")
Rel(systemA, systemB, "Reads", "SQL")
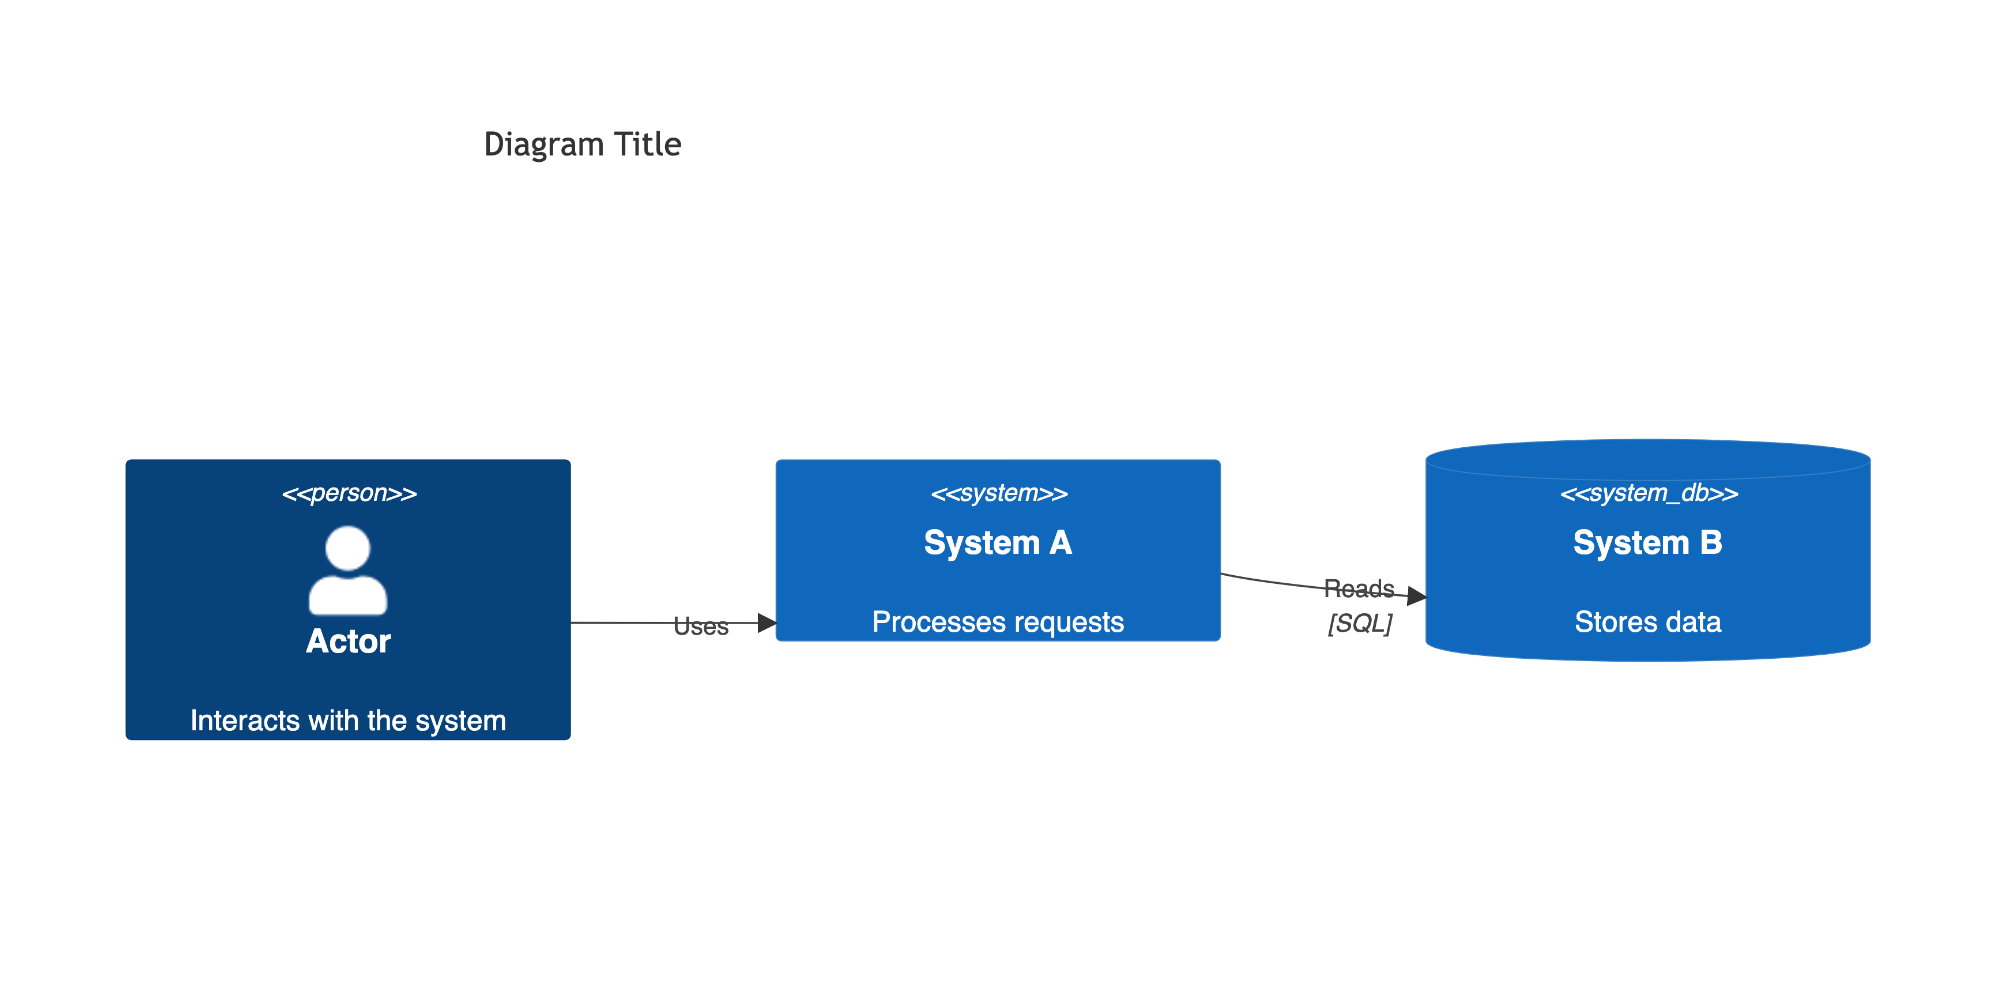
The above figure illustrates a basic C4 context diagram in Mermaid, illustrating the interactions between an actor and systems. For more advanced C4 diagram features and configuration options, refer to Mermaid’s C4 Diagrams documentation.
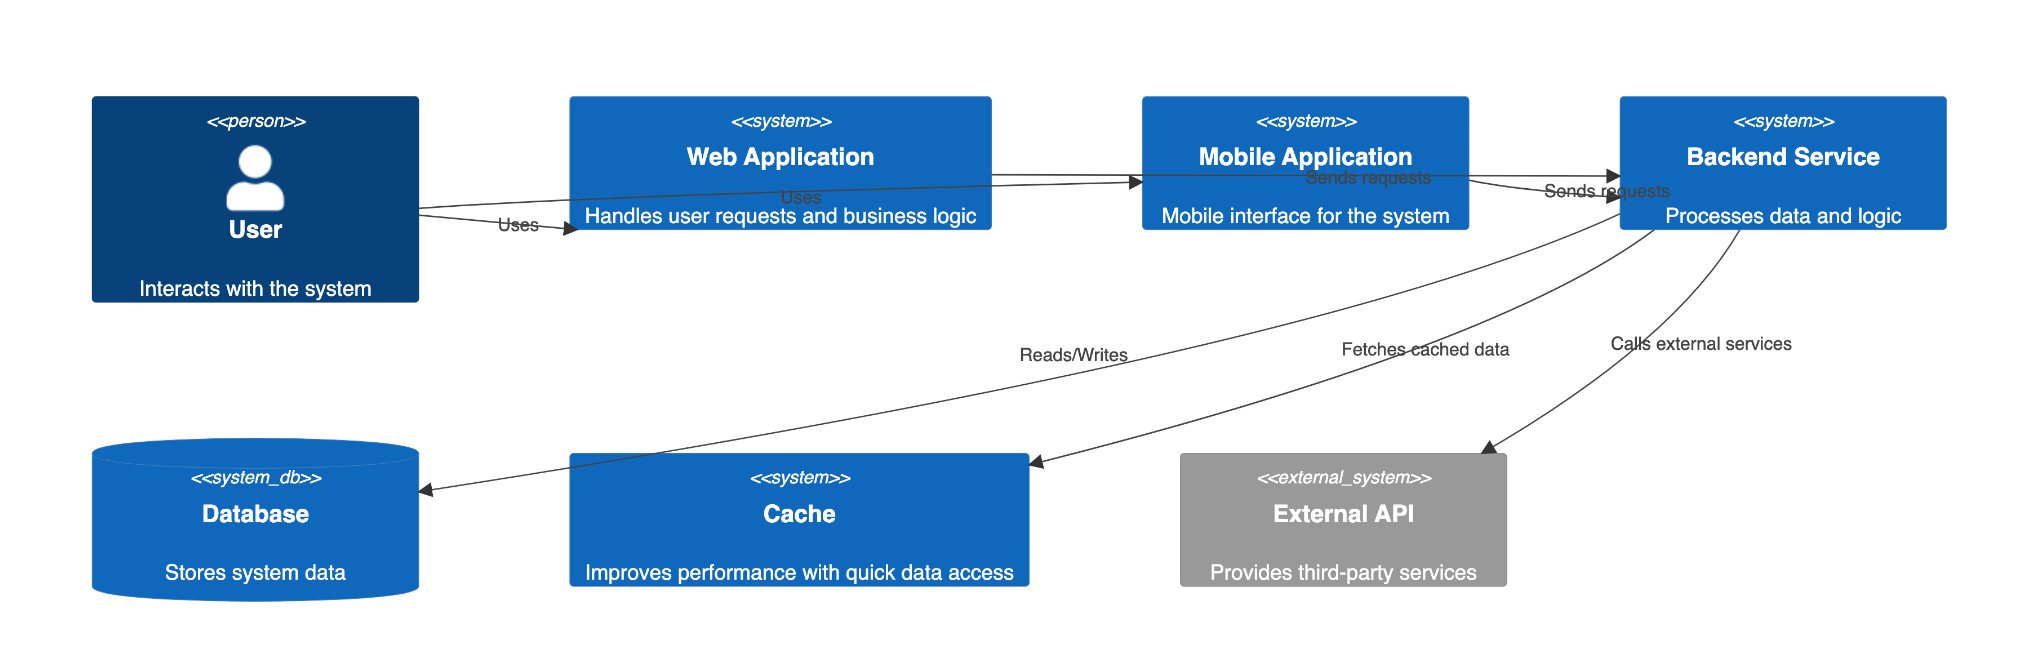
The example below uses a C4 diagram to represent the relationship between users, applications, services, data storage, and external systems in a generic software architecture.
Gantt
Gantt charts are used to visually represent a project’s schedule and progress. The following code provides a framework for implementing a Gantt chart using Mermaid syntax in Lucidchart.
Code:
gantt
title Gantt Chart Title
dateFormat YYYY-MM-DD
section Phase 1
Task 1 		:t1, 2025-01-26, 10d
Task 2		 :after t1, 15d
Task 3 		:2025-02-10, 20d
section Phase 2
Task 4 		:t2, 2025-03-01, 5d
Task 5 		:after t2, 30d
Task 6 		:15d
section Phase 3
Task 7 		:2025-04-10, 10d
Task 8 		:after t2, 10d
section Phase 4
Task 9 		:2025-04-25, 5d
Task 10 	:2025-04-30, 5d
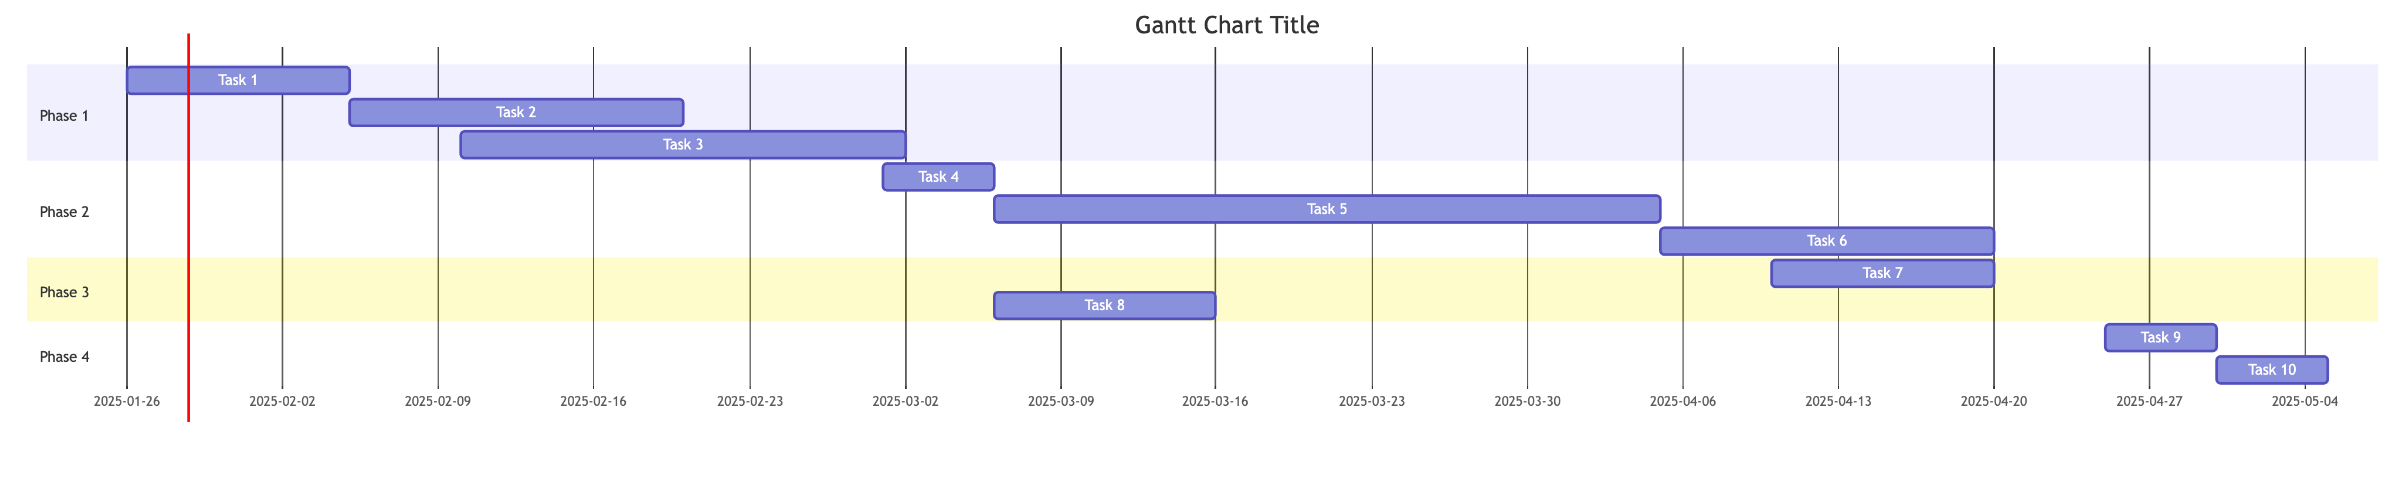
The above code shows a Gantt chart in Mermaid, outlining tasks and their dependencies across multiple project phases. Task dates should be updated to align with your current project timeline. For more advanced Gantt chart syntax and styling options, refer to Mermaid’s Gantt diagrams documentation.
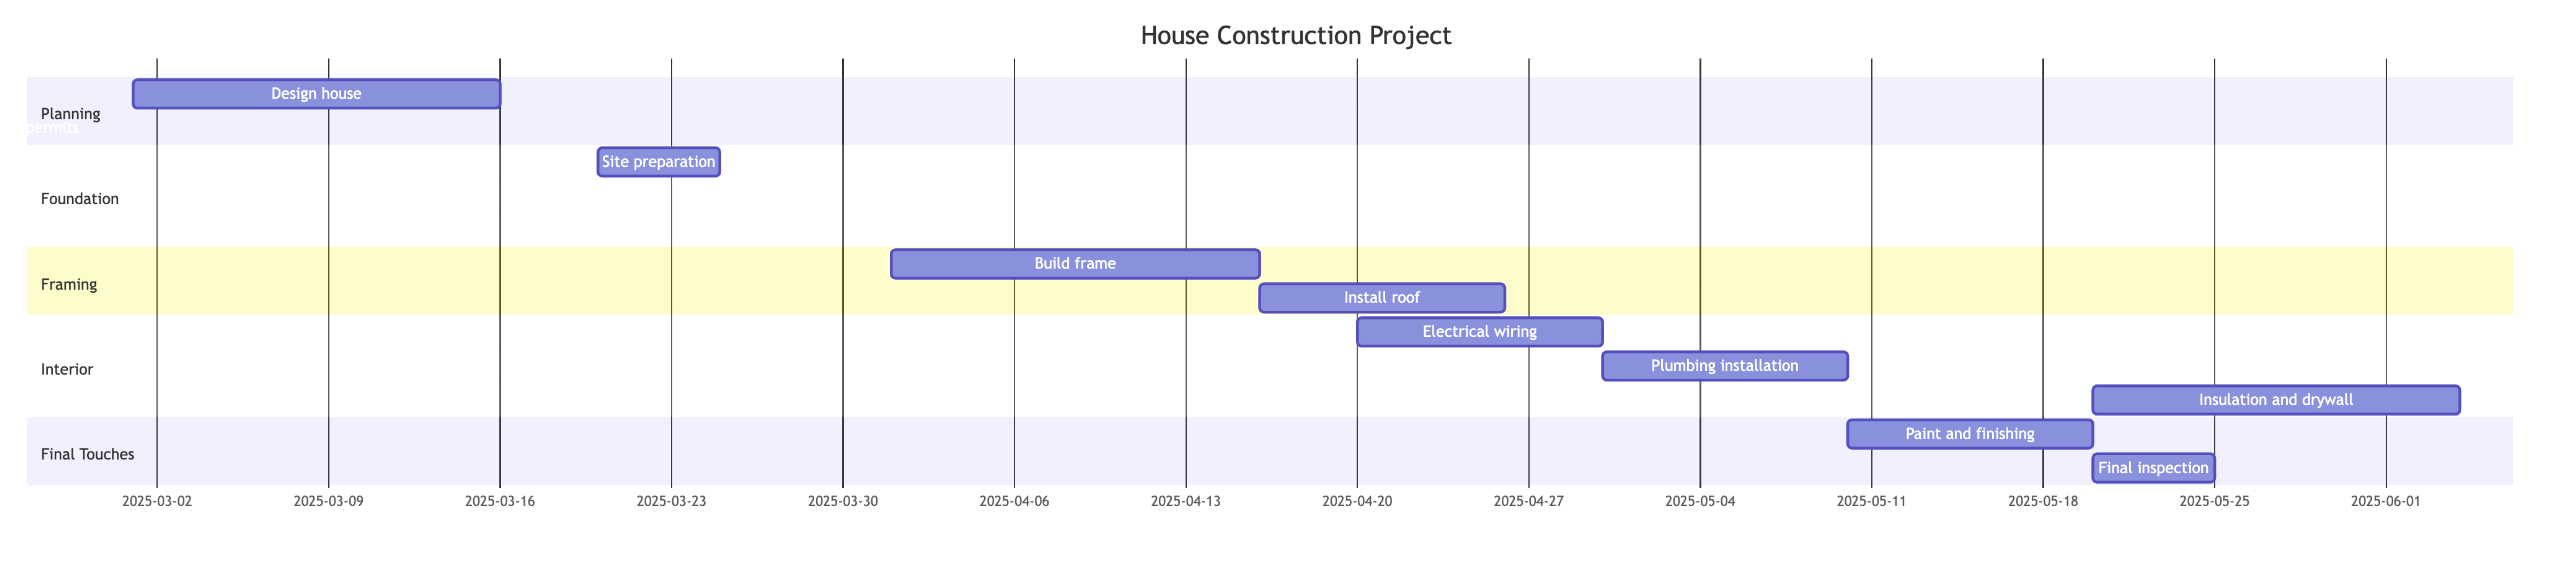
The example below uses a Gantt chart to outline the timeline and key milestones of a construction project. This includes phases such as planning, foundation work, framing, interior installation, and final touches.
Entity Relationship (ER)
ER diagrams allow you to visually represent a database or system, illustrating the relationships between different entities. The following code provides a framework for implementing an ER diagram using Mermaid syntax in Lucidchart.
Code:
erDiagram
    ENTITY1 {
        int id
        string name
        string attribute1
        string attribute2
    }
    ENTITY2 {
        int id
        string name
        date creation_date
        string description
    }
    ENTITY3 {
        int id
        string name
        string status
    }

    ENTITY1 ||--o{ ENTITY2 : "related to"
    ENTITY2 ||--o{ ENTITY3 : "involves"
    ENTITY3 ||--|{ ENTITY1 : "affects”
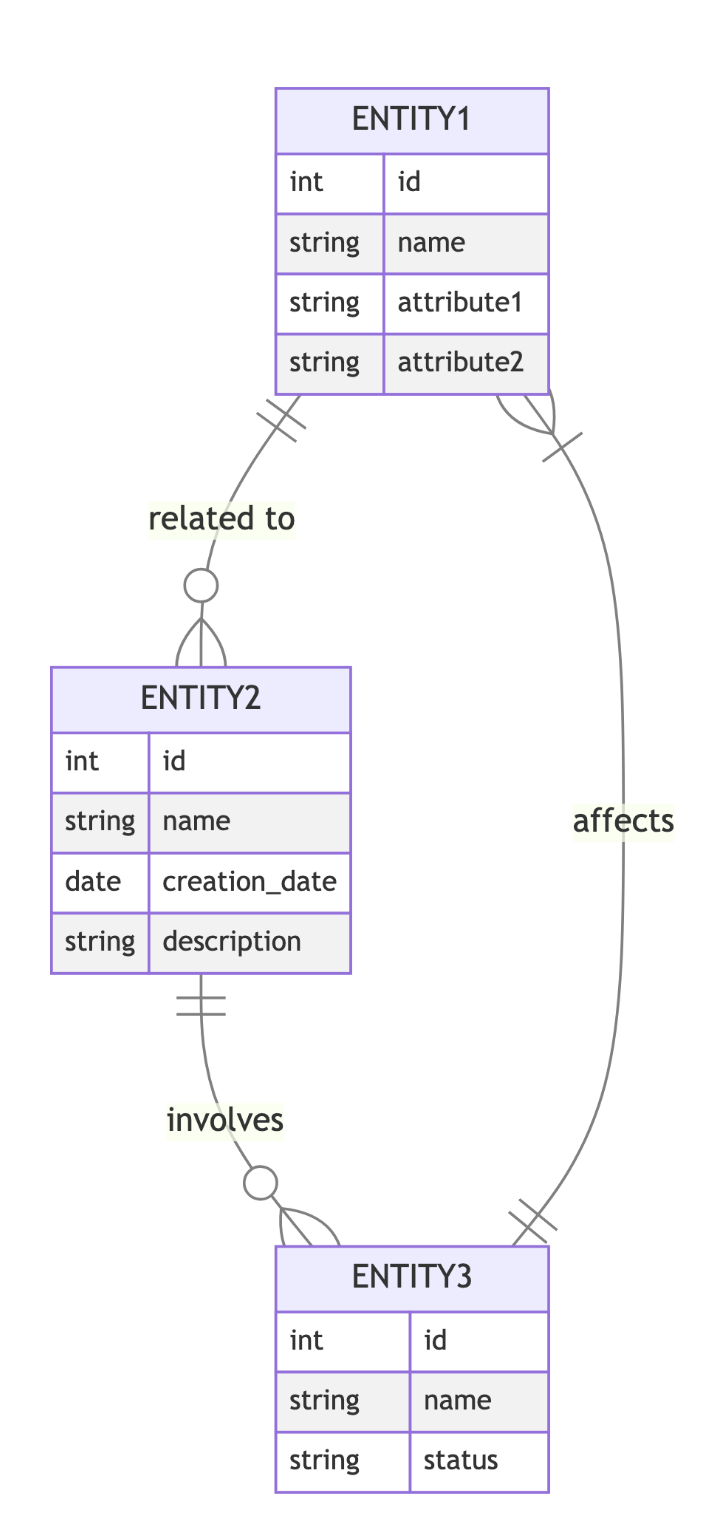
The above figure shows an ER diagram in Mermaid, illustrating the relationships between three entities with their attributes and connections. For more advanced ER diagram syntax and customization options, refer to Mermaid’s Entity Relationship diagrams documentation.
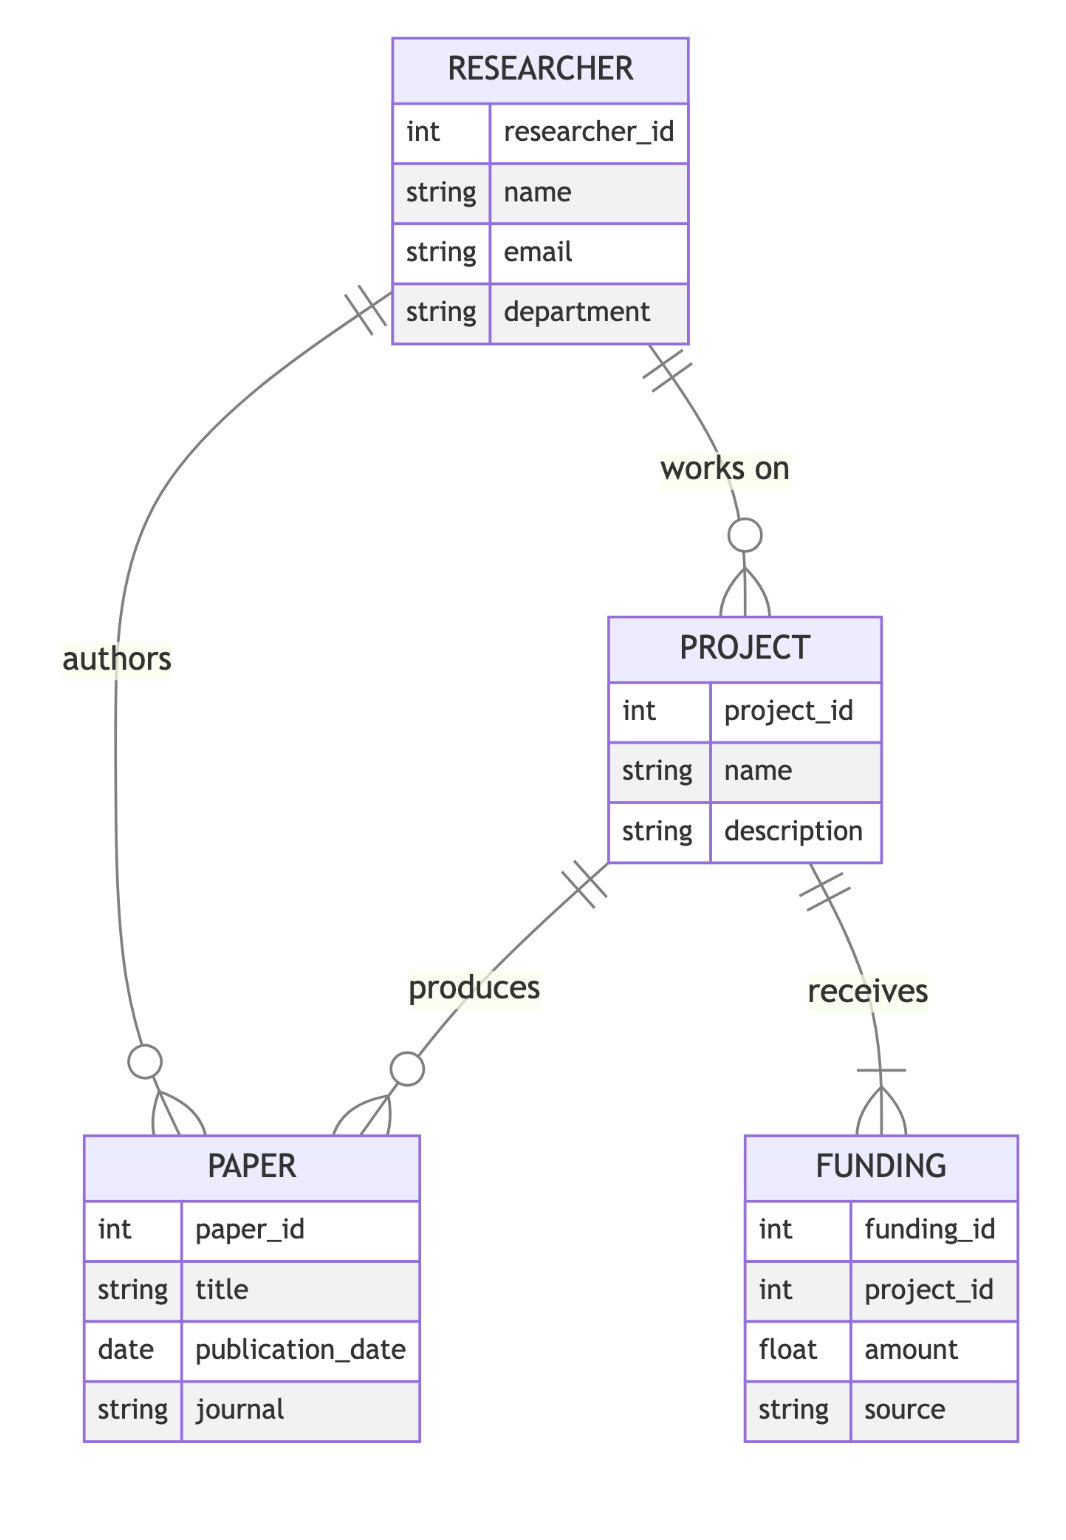
The example below uses an ER diagram to represent the relationships between researchers, papers, projects, and funding.