Sometimes, it’s nice to be able to see the full date range of a timeline card on hover, rather than needing to click into the card itself. You can make this happen using the Lucidchart feature of conditional formatting, and some Lucid formulas!
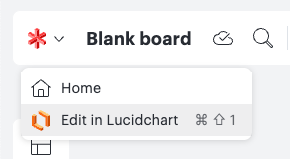
Let’s say you have a timeline in Lucidspark, with a few cards on it. If you’re on the Enterprise version of Lucid, you can easily switch the canvas toolset from Lucidspark to Lucidchart (in the top left corner, click on the logo and choose the other product).
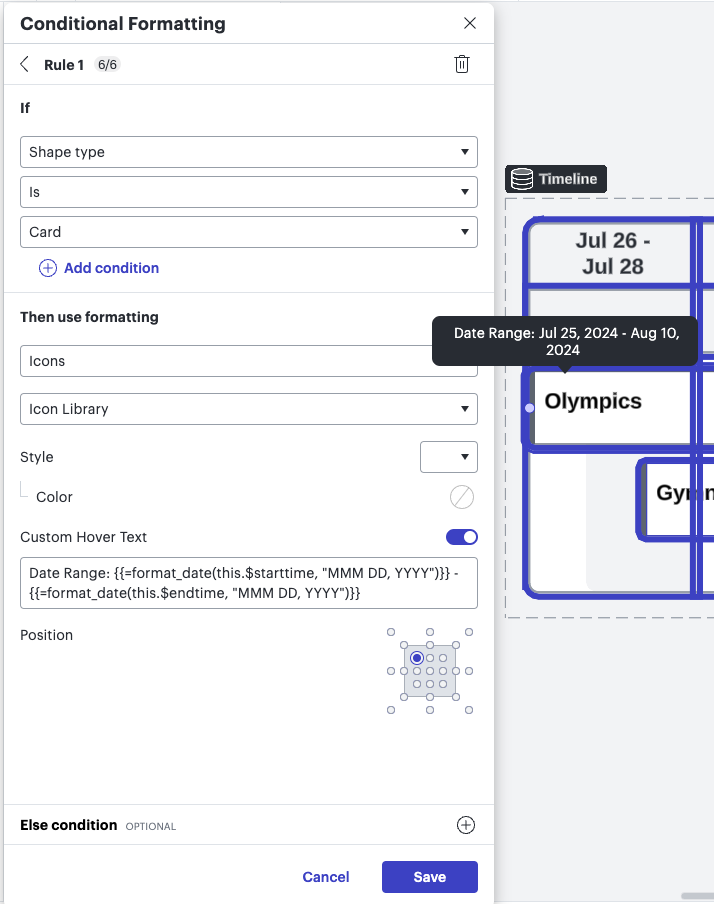
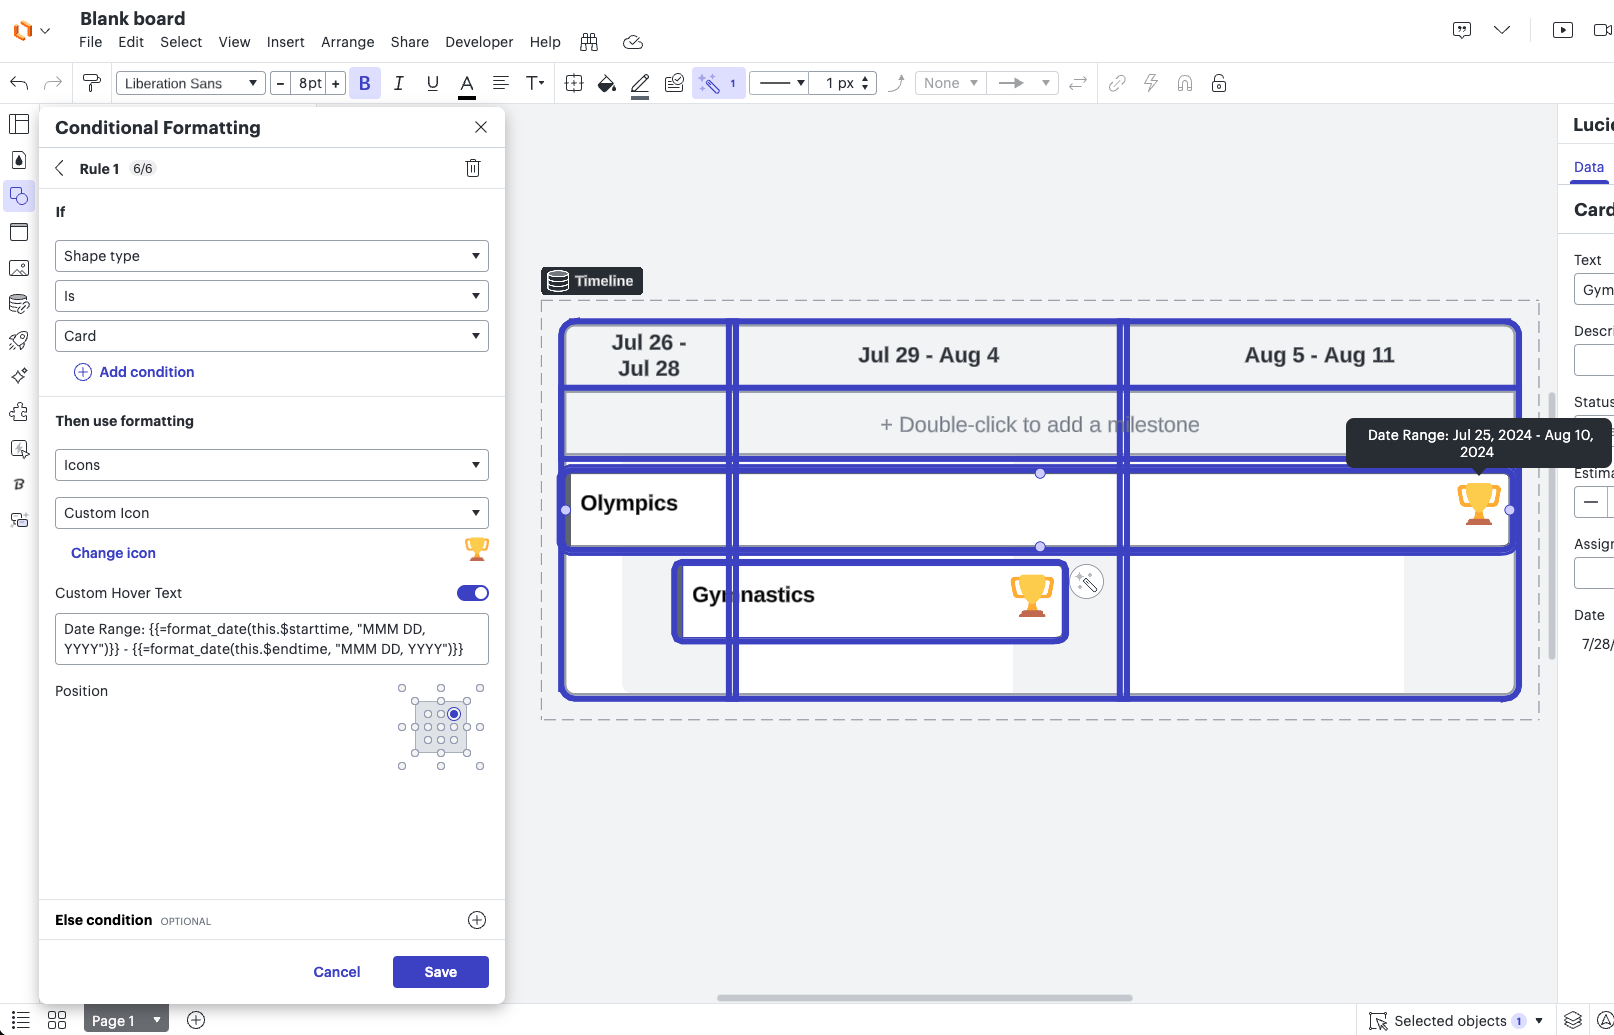
Open up the conditional formatting panel (the magic wand) and set a rule to apply if “Shape type” “Is” “Card” - and then, set the formatting to be “Icons” and choose your icon. You can even upload a custom icon!
Then, go ahead and add “Custom Hover Text” - with something like the following::
Date Range: {{=format_date(this.$starttime, "MMM DD, YYYY")}} - {{=format_date(this.$endtime, "MMM DD, YYYY")}}This is using interpolated text - a formula set in between double curly brackets - to display the actual start and end time from the card itself, and formatting that time to be something like “Jan 01, 2024.” It will display when you hover over the icon on the card!
If you don’t want a visible icon, you can always choose one of the standard icons like a simple dot, and set the fill color of the icon to be “invisible” - just make sure you position the icon somewhere intuitive, like the top left where the title of the card lives, so that you can find it on hover.