
Indicate Swimlane On-Hover - Hack for inability to "Freeze" lanes!

  • 17 January 2024
  • 4 replies
  • 110 views

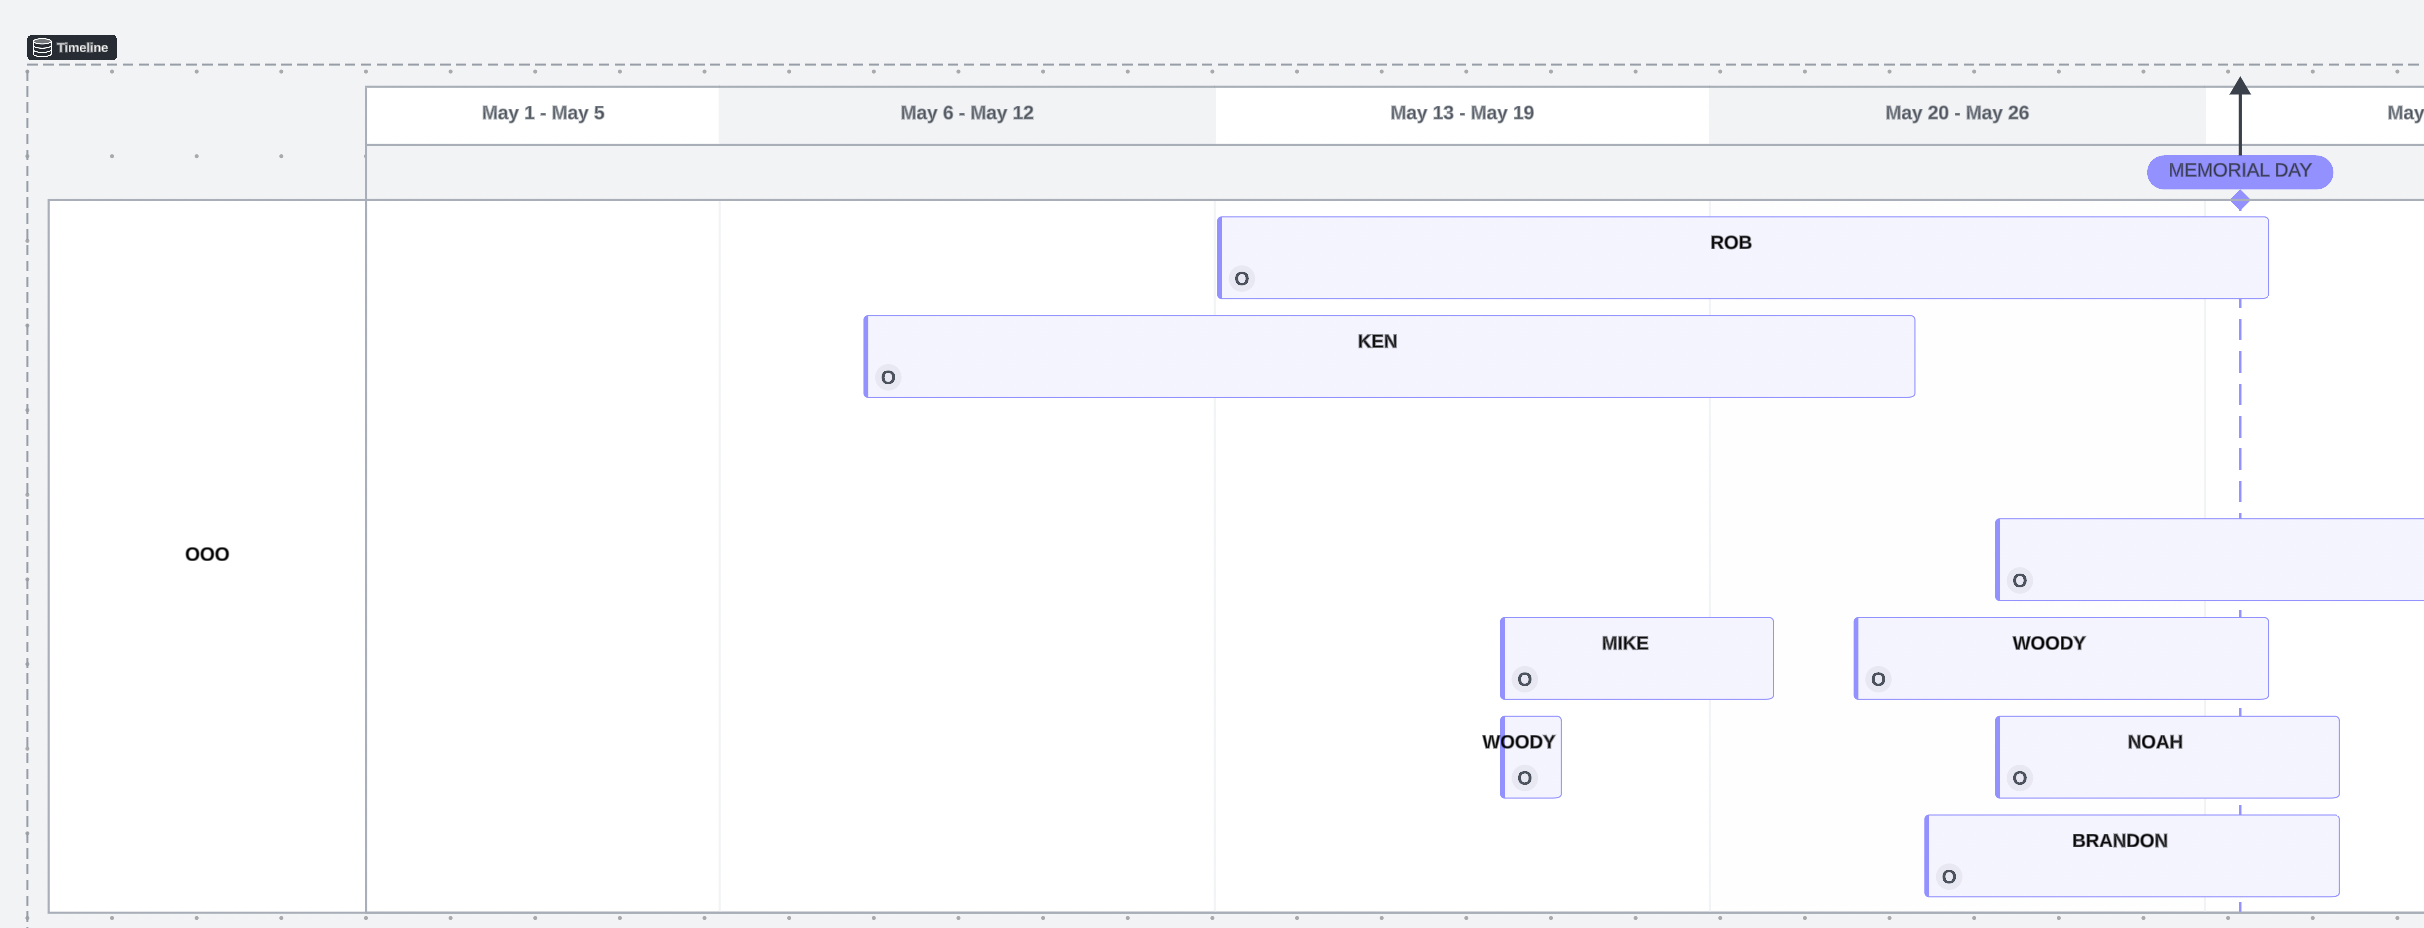
Hi! I’m one of the Sr. SE’s at Lucid and I wanted to share a way to workaround the inability to “Freeze” swimlane headers in a doc. 


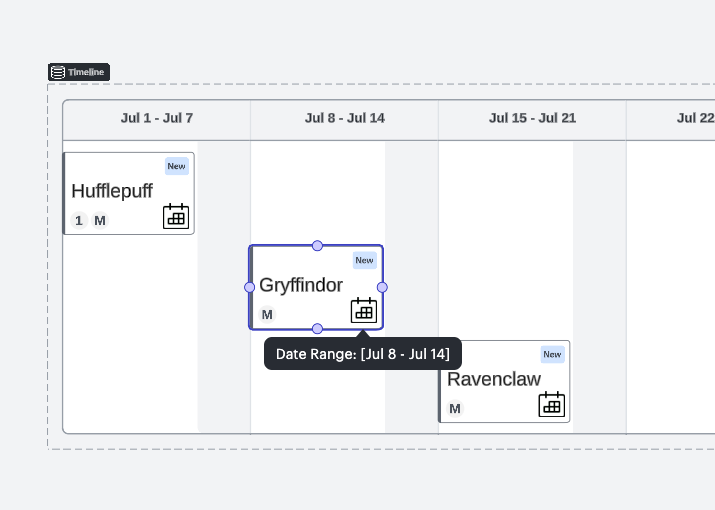
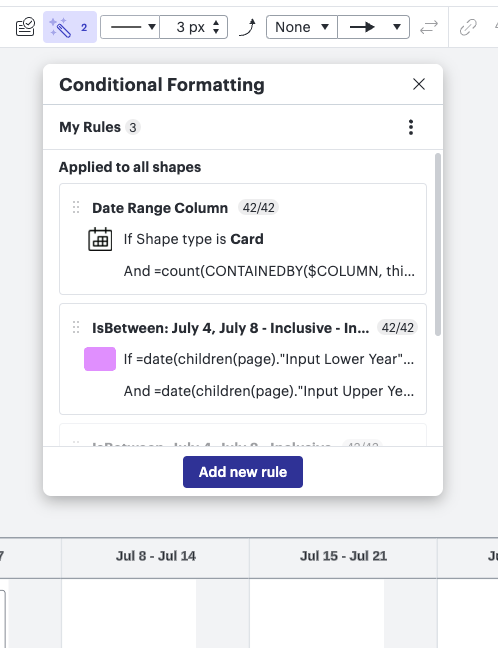
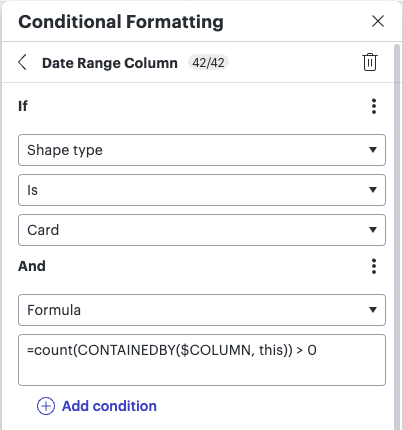
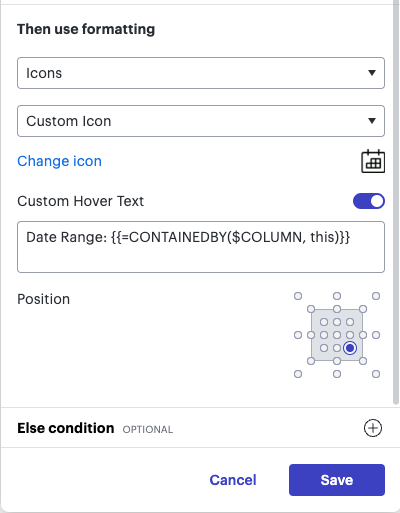
It’s hard to see which lane something is in when you scroll away from the lane headers - but a a handy conditional formatting rule can let you hover over a shape, and see which lane it’s in - check this out!


https://play.goconsensus.com/u168f9be8

Comments

Badge

Hi @khaleesioflucidchart,

Thank you for the tutorial this was super helpful. I wanted to ask if it’s possible to adapt this solution so the hover feature displays the shape location on Lucid Cards. Below you can see an example of the format we’re using for a business plan using the Implementation Plan Template. After many Swimlanes (Rows) are added it’s difficult to identify the Dates (Columns) without scrolling up and down.


The Date ranges are identified as a ‘Shape location’ but I’m unsure how to display the Date attribute (Columns) instead of the horizontal Swimlane name. I would appreciate your help!


Userlevel 4
Badge +5

Hi! Absolutely: Lucid has some formulas that allow for the concept of finding what a card is “contained by” and you can specify even further a specific type of element that you’re seeking, like “Row” or “Column”  or “Swimlane.”


TL;DR


 The formula(s)  that you’d want to use to get the title of the row(s) is something like this:

//To get the list of "Columns" a shape in contained within:
=containedby($COLUMN, this)

//To verify if a card is even inside a column at all (vs free on teh canvas):
=count(containedby($COLUMN, this)) > 0


EXAMPLE WALK-THROUGH:

So, in this example, I’ve got a little calendar icon that appears on the cards that on hover, tells me the Date Range (the column title).


First, make sure you swap the canvas from Lucidspark to Lucidchart, so that you can leverage conditional formatting:


When you open up the conditional formatting panel by choosing the magic wand icon, make sure you don’t have any shapes selected BEFORE you click “add rule” - you can just click a blank spot on the canvas to ensure nothing is selected. This ensures that the rule is applied to all shapes.


Now you can add conditions!

You can see my example rule, where I also specify that I only want this apply to shapes of the “card” type:

Note: in this section, I choose to count how many items are in the list of “Columns” that this card is “containedby” - why? I really only want this to show up IF the shape is a card, AND that card is inside a column at all! Basically, leave my cards on the canvas alone.


Then, in the next section of the rule, I ask Lucid to add an icon. I actually chose to upload a custom icon!  A little calendar shape. On hover over the icon, I ask Lucid to display the title of the column, which will be the date range. To do that, you can simply type your text and then insert any formula inside {{ }} to display the calculated answer.


And there we have it! An easy way to see in which “Date Range” aka column the cards are located.


Badge

Hi @khaleesioflucidchart,

Thank you so much for the detailed response, this is much appreciated.


I have one last question;

Is there a way to display the entire date range of a card and not just the one for the top-left corner of the card?

I noticed there are the $starttime, $endtime and/or $estimate attributes which might be what I’m looking for but I’m unsure how to ‘call’ for it within the On-Hover text.


Thanks again for all your help!

Badge

@alessandra.sinibaldi Here’s a post with a solution for showing the full date range:


Reply