When we met with Okta – the San Francisco-based identity management cloud software company – to learn about how they use Lucidchart in their day-to-day work our team was pleased to discover how deeply they value visualizations.
Okta uses Lucidchart to create all types of visualizations.
From wireframes to timelines to sequence diagrams Okta’s teams rely on Lucidchart to communicate the complexities of security software to their clients. Dan Marma a sales architect at Okta explained how “Lucidchart diagrams inspire confidence with the customer so they can say ‘Hey these guys have done this before. These diagrams look good. They make sense. They’re readable. What we’re doing is no longer this confusing thing.’ Remove that element of confusion and people feel better about their decision."
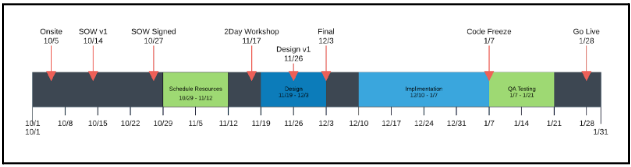
Not only does Okta create custom templates to encourage the use of visualizations but they also take advantage of the extensive shape libraries available on Lucidchart.
Specifically they use the UML shape library to create sequence diagrams with UML markup.
Sequence diagrams allow you to visualize how operations occur over time.
You can use UML markup to create a sequence diagram that represents anything from backend code to how security systems interact with each other. These diagrams are particularly useful when you need to visualize both how objects work together and in what order.
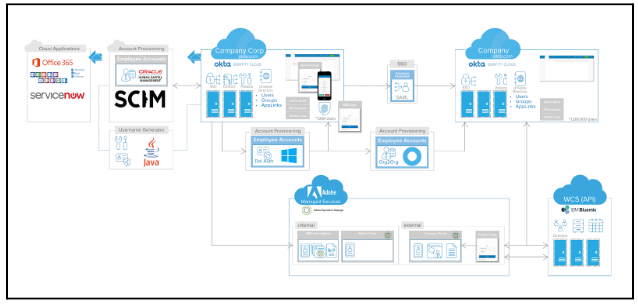
In Okta’s case they use sequence diagrams to illustrate their multi-factor identification feature as shown below.
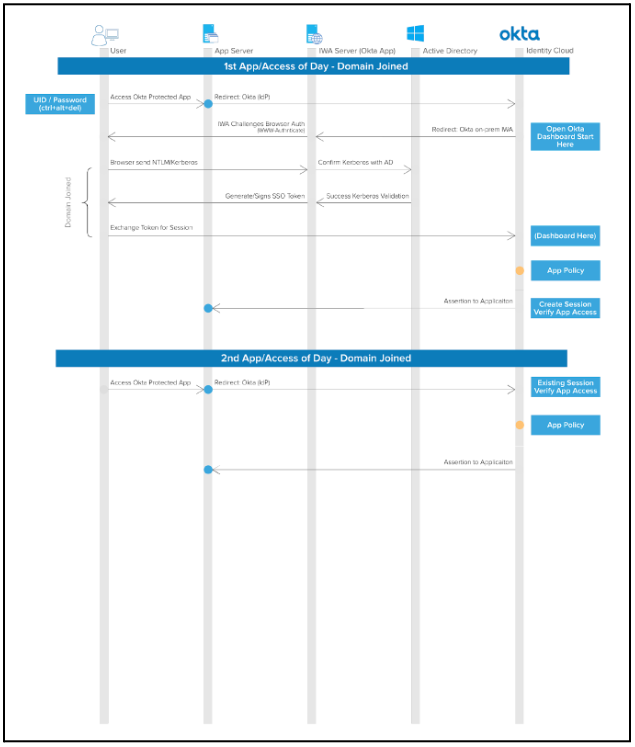
This sequence diagram demonstrates how Okta’s multi-factor authentication process functions and therefore allows potential Okta clients to see each step involved.
By documenting this process through a collaborative sequence diagram Okta sets their sales representatives up for success because sales reps are able to quickly reference the visualization to answer clients’ most technical questions.
Additionally once the sales rep closes the deal the diagrams remain relevant because Okta’s customer success team will update the diagrams with more details that explain exactly how Okta will interact with the client’s current infrastructure and security systems. From the sales pitch to implementation and training Okta’s visualizations save time for both parties as they eliminate the need for extensive video calls and conferences.
According to Okta’s Regional Director of Professional Services “Okta’s number-one company value is customer success” and the visual documentation Okta creates with Lucidchart sets their clients up for a successful Okta experience from the very beginning of the relationship.