Dear Colleagues,
i am seeking to create a prompt that will generate a BPMN process diagram with some degree of maturity. Please see prompt below (note COT, 2nd run):
diagramtype: process diagram
Context: Chemical Processing and Refinery systems
Domain: Oil & Gas Processing
Instructions for Result: create single process diagram
Format for Answer: BPMN 2.0 Diagram
Background: Refineries uses a number of industry standards and practices to ensure the safety, health, and environmental performance of its refineries.
Standards: API Recommended Practice 754
Standards: ISO 14001/45001
Standards: ISO 50001
Standards: ASTM D6792 and ISO 17025
Standards: Operations Integrity Management System (OIMS)
Standards: ISO 27001
Standards: PAS 2060
Standards: ISO 55001
Standards: ISO 37001
Standards: ISO 22301
Standards: ISO 9001
Process: Piping and Instrumentation Diagram (P&ID) Update Process
2. P&ID Update Process - The Piping and Instrumentation Diagram (P&ID) represents the layout and interconnection of equipment. Accurate updates ensure alignment between design and operational data.
Steps:
2.a Initial Design: Create P&ID with assigned tags from the tag register.
2.b Review and Approval:
2.b.i Cross-check the P&ID with the tag register for consistency.
2.b.ii Conduct team reviews for process accuracy and compliance.
2.c Revision Control:
2.c.i Implement a document control system for P&ID revisions.
2.c.ii Assign revision numbers or letters to track changes.
2.d Change Management:
2.d.i Update P&IDs when modifications (e.g., new equipment or process changes) occur.
2.d.ii Ensure all updates are communicated to the tag register, ERP, and asset management systems.
2.e Final Validation:
2.e.i Validate P&IDs with field verification during commissioning and operations.
Question: create a process diagram that will detail the critical process of events and dataflow across all systems in the refinery ecosystem to represent tagging equipment.
Source: https://www.iso.org/standards.html
Source: https://www.astm.org/products-services/standards-and-publications.html
Source: https://www.api.org/oil-and-natural-gas/health-and-safety/refinery-and-plant-safety/process-safety/process-safety-standards/rp-754
Source: https://www.nqa.com/getmedia/b4c2bb85-f725-4ed3-9045-be61aac4428f/NQA-PAS-2060-Implementation-Guide.pdf
Persona: Solution Architect
Systems: Piping and Instrumentation Design System
Temperature: 0.65
Top_k: 50
Top_P: 0.1
The LLM should use the supplied SOURCE UTLs as authoritative for industry standards.
Tuning parameters should attenuate the output.
output should be a detailed BPMN process diagram, getting information for process from the industry standards and sources provided at a minimum.
If possible a data source can be provided that has more process task or task/artifact information (ie: SIPOC).
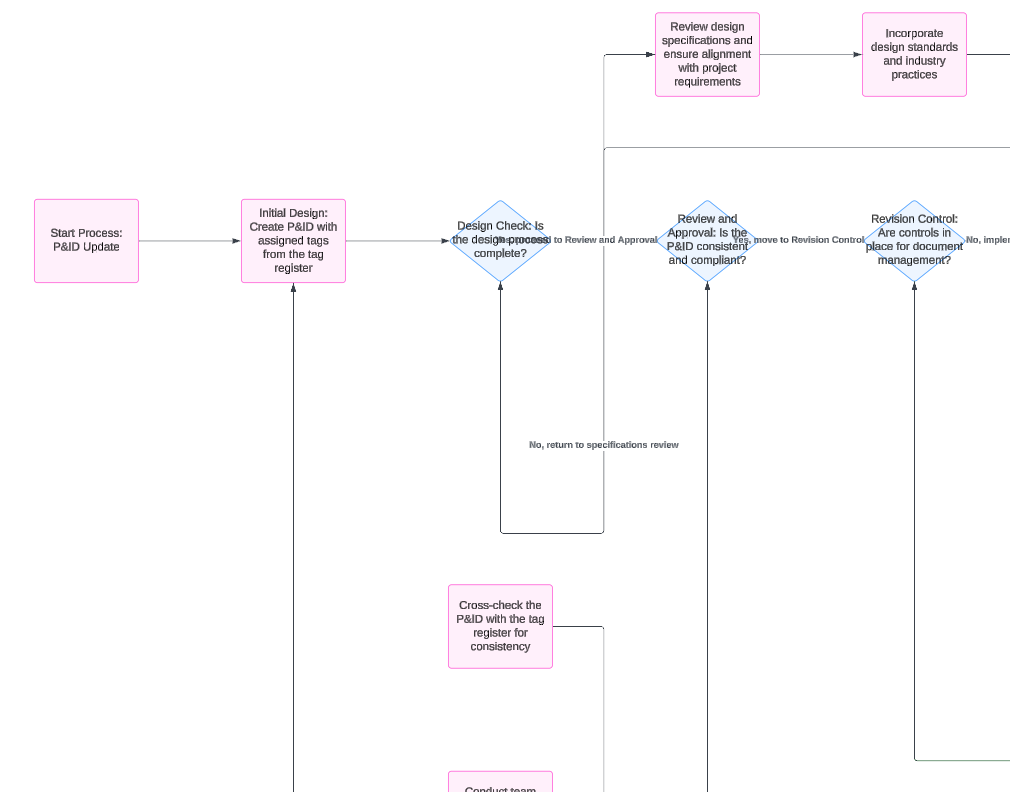
An example of some of the current output:

What recommendations can you make to mature the above prompt for more fidelity in the output. Lastly, while BPMN was specified, the shapes used were generic flowchart, which need be corrected.
Thank you