Do you want to visually portray steps and documents in a process? Does your process involve multiple actors or categories? If so build a flowchart! Follow this walkthrough of the Business process flow example to understand how to work with flowcharts in Lucidchart. You can also customize this template to suit your own teams and processes!
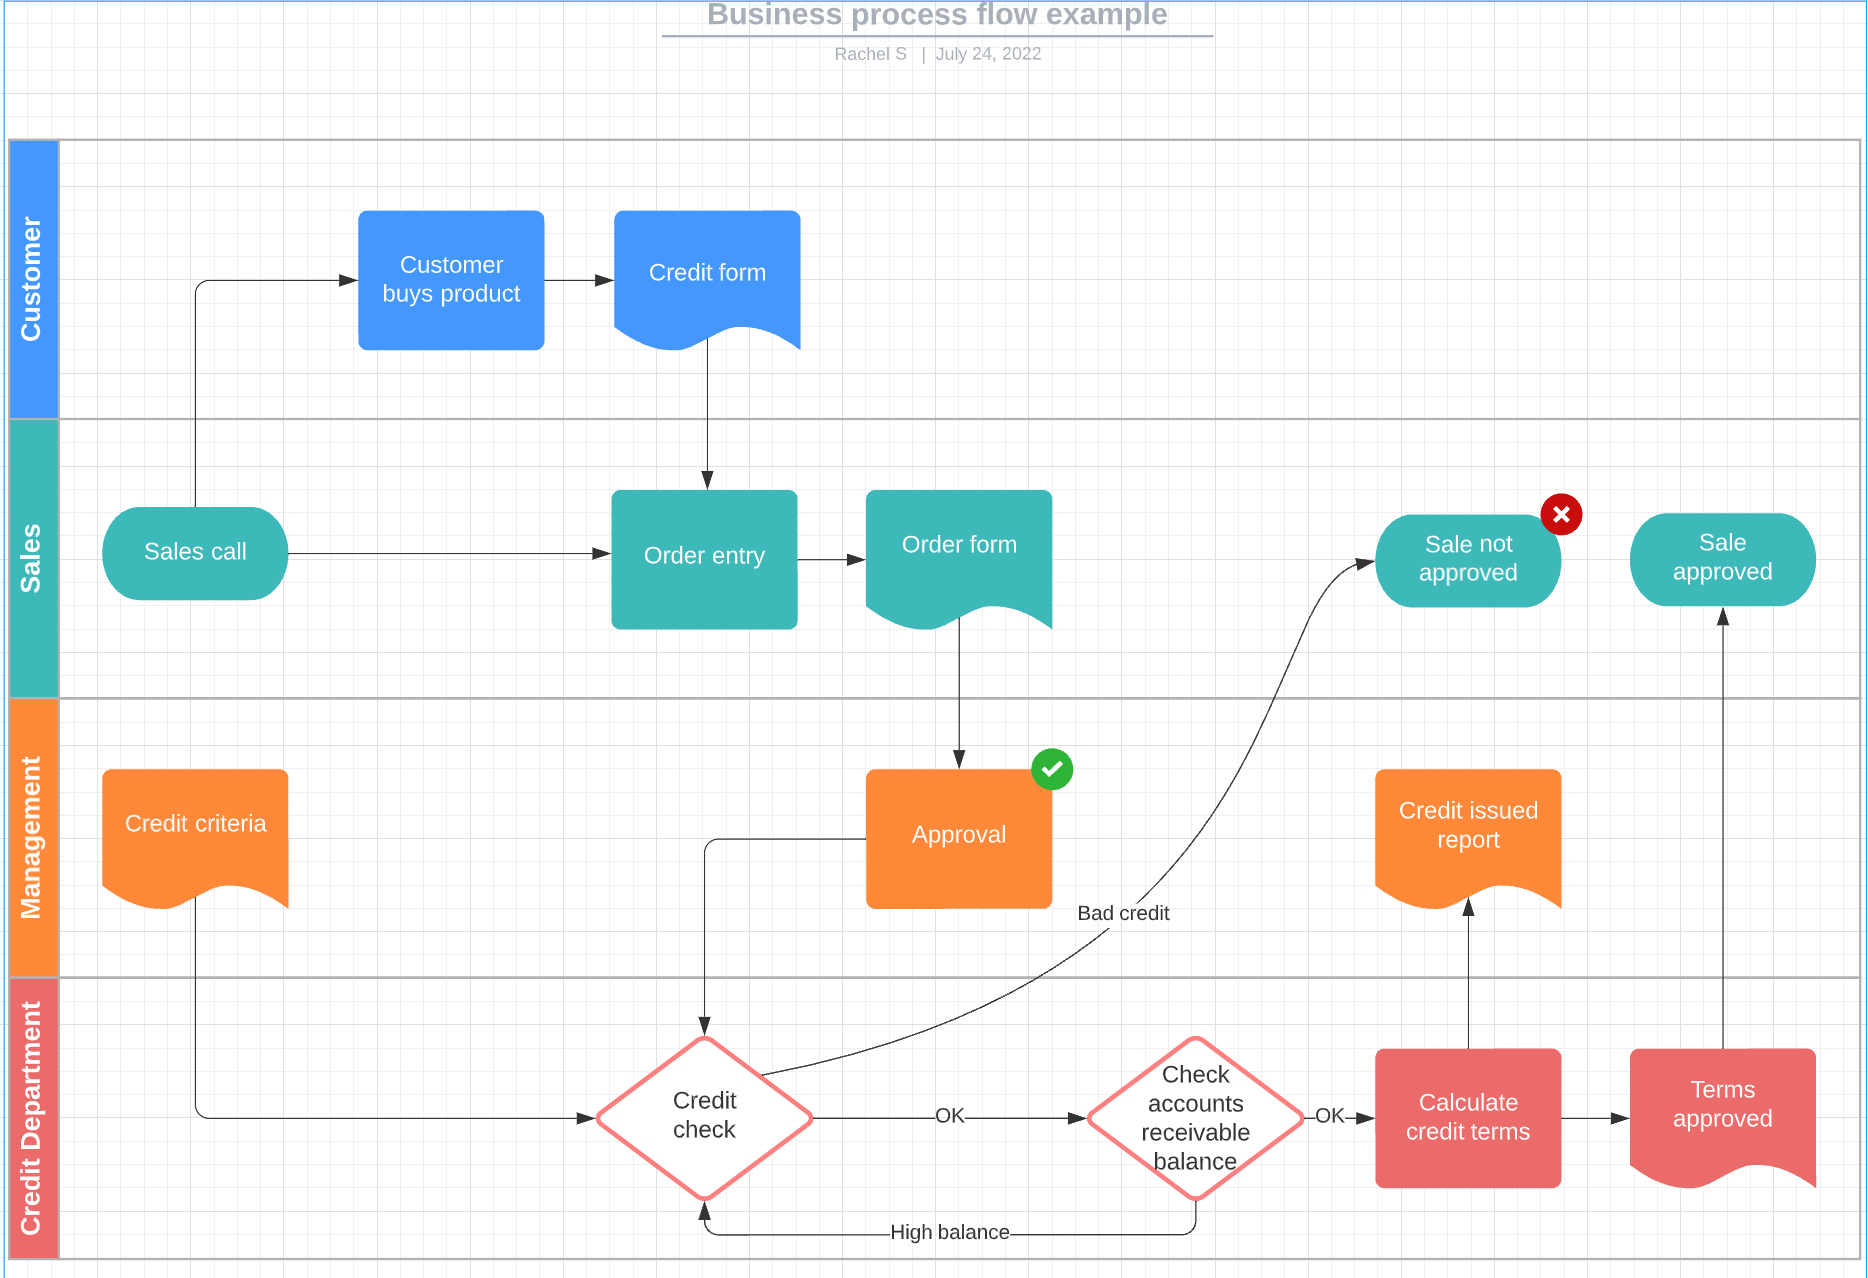
This template includes both advanced and basic flowchart shapes. Swim lanes are the advanced shapes that contain the entire process and organize steps into four categories: responsibilities of the customer sales team management and credit department.
Within swim lanes basic flowchart shapes depict stages and documents required to make a sale. For example the flowchart begins with an oval terminator shape representing a sales call. Afterwards the sales team enters the order and the customer buys the product. These steps are both depicted with rectangular process shapes because they’re clear actions. In this example the swim lane shape is useful because it illustrates how different departments (sales and customers) can act simultaneously.
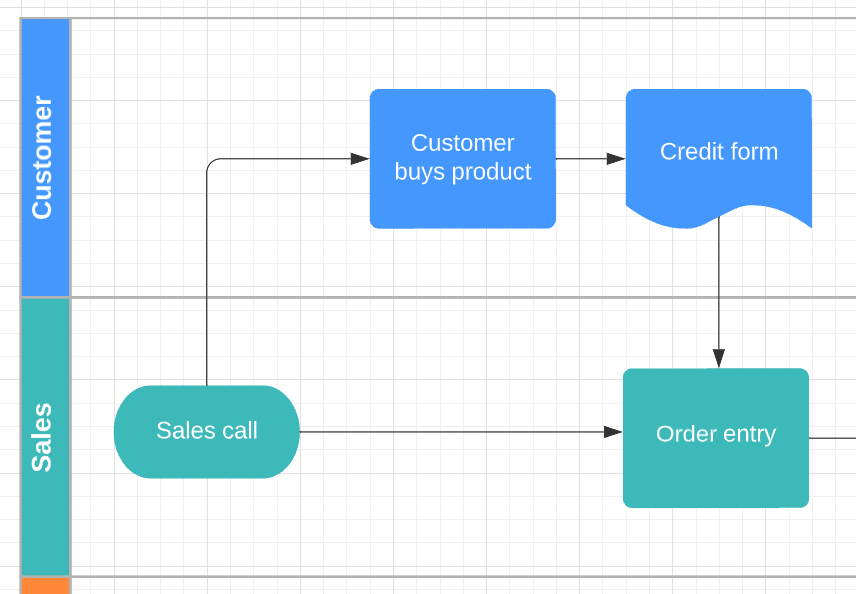
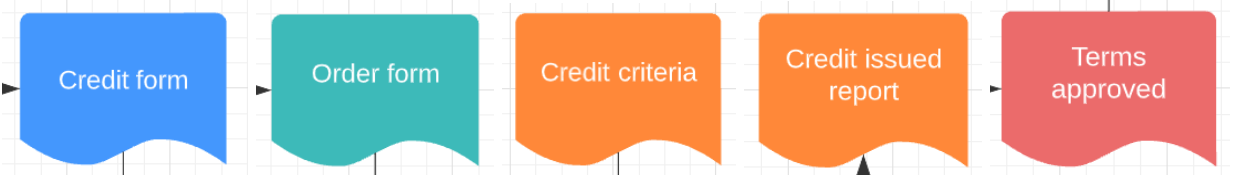
Next take a look at the customer’s swim lane. After buying the product the customer fills out the credit form (depicted by the document shape). Notice that the sales team management and credit department also fill out forms during the process because their swim lanes contain document shapes as well.
Now if you direct your attention to the credit department’s swim lane you’ll see diamond decision shapes. Two different paths emerge from each decision shape depending on the step’s outcome. For instance the process either continues to checking the account’s receivable balance after the credit check if the customer’s credit is okay or the sale gets denied if their credit is bad. Use decision shapes when different paths result from different outcomes of a step.
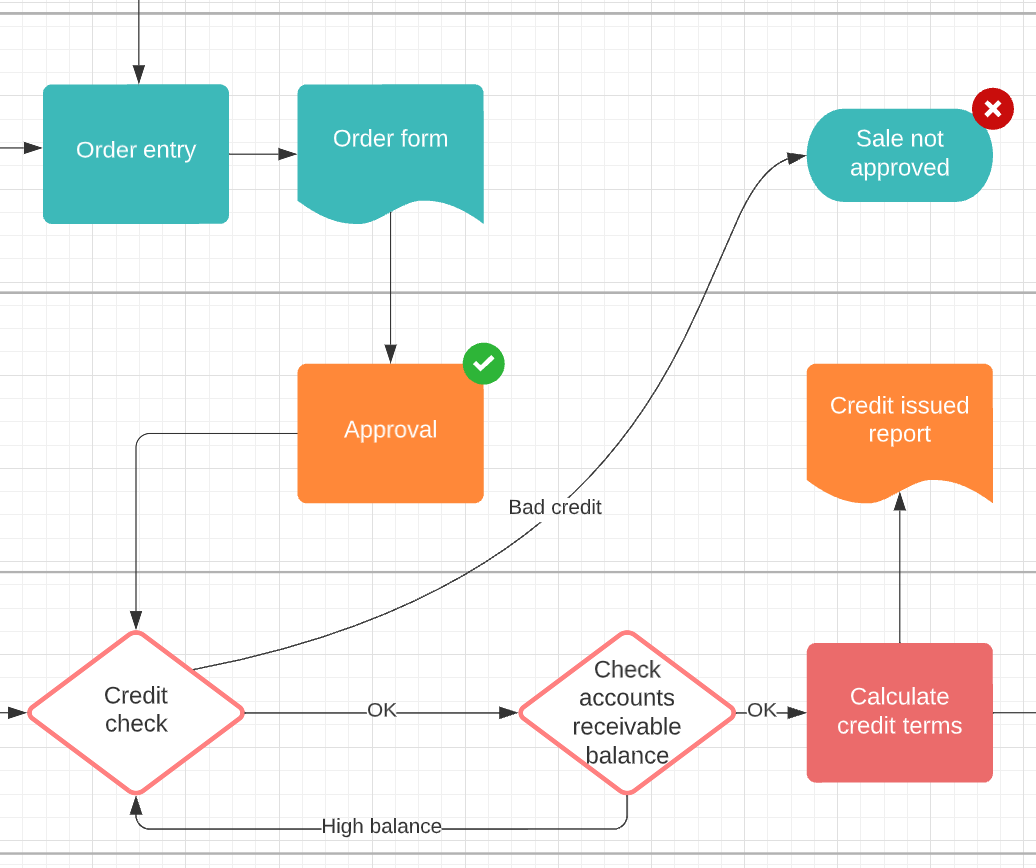
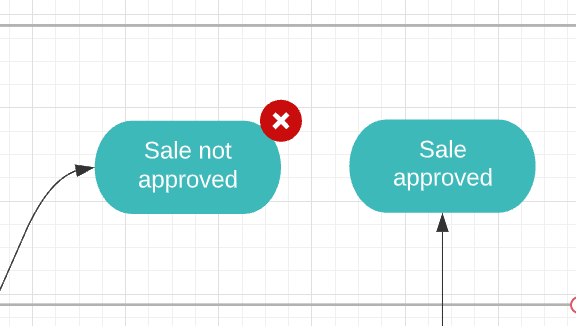
Finally this example can end in one of two ways: the sale gets approved or it doesn’t get approved. Both of these results are marked with a terminator shape to signify the end of the process.
Overall the flowchart shapes are a great way to visualize actions documents and responsibilities in a process. Feel free to share how you’ve used this template!


