I have a few ideas for making org chart layout more flexible:
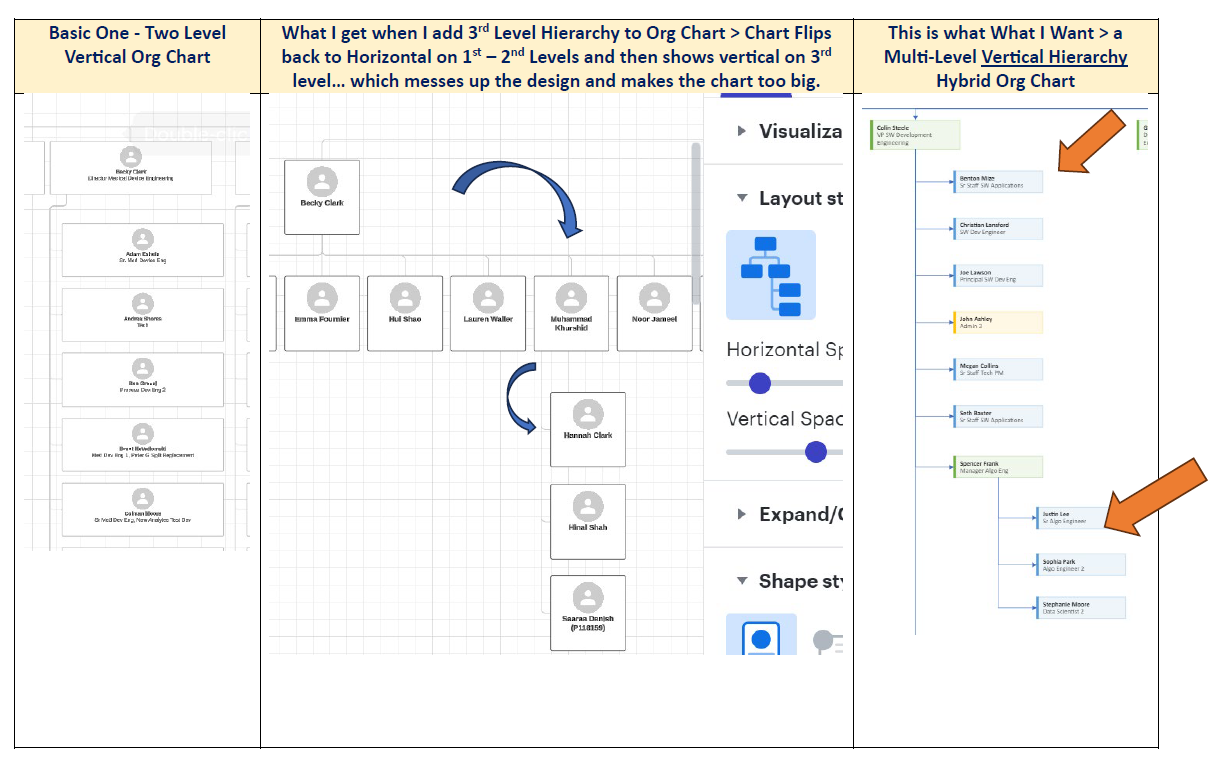
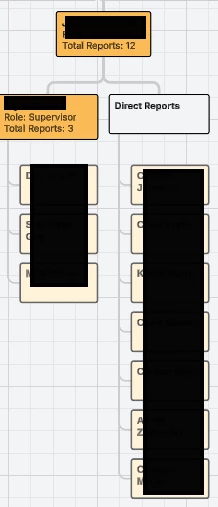
- Rather than having the “across” or “down” layout option for reports apply to the whole chart, be able to select a box and have the layout apply to that stream. So we can have reports shown horizontally generally, but for certain people show their reports vertically.
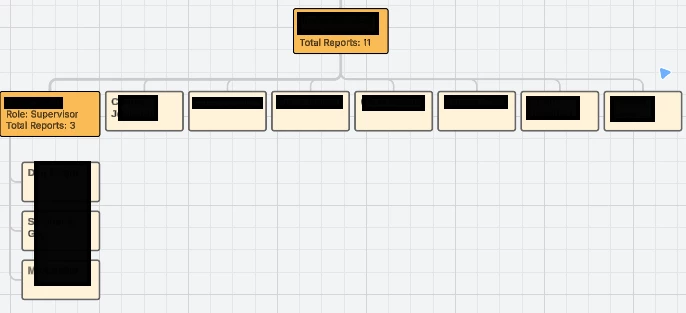
- As an extension to this, sometimes you might have 2-3 reports for most people but then you get to someone with 20. Both vertical and horizontal layouts cause massive blank areas, so being able to specify a grid structure would be great. In InDesign I’d lay these people out in something like a 4 column layout with 5 per column
- Be able to choose whether we want boxes to line up vertically or just have consistent spacing between them. If we have half the chart with boxes that are large, the other half looks too spaced out. I’d rather not have different columns lay themselves out according to the largest box in a neighboring column
- Being able to click a person and have them and all their reports show within a shaded box. Although you can conditionally format individual shapes, showing a “group” within a shaded area is visually stronger. Sure, you can draw a box manually, but as it doesn’t move with the chart items it’s not that helpful.
- Sometimes you have one role with many people in it. Say, “Developers” and then 5 names. Being able to have them as separate items in Excel yet show as one box in Lucid (one role title, five employees on a separate line each) would be amazing. I can do them all in one line on Excel, but then you can’t capture attributes for each person such as “company”, “gender” etc.