
In the post at:


https://lucidchart.zendesk.com/hc/en-us/community/posts/207022906-How-do-I-customize-the-Table-Data-Grid-shape-in-UI-Mockups-


it states:


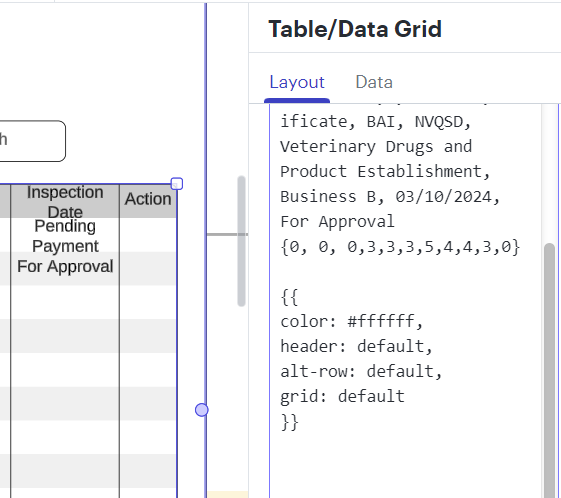
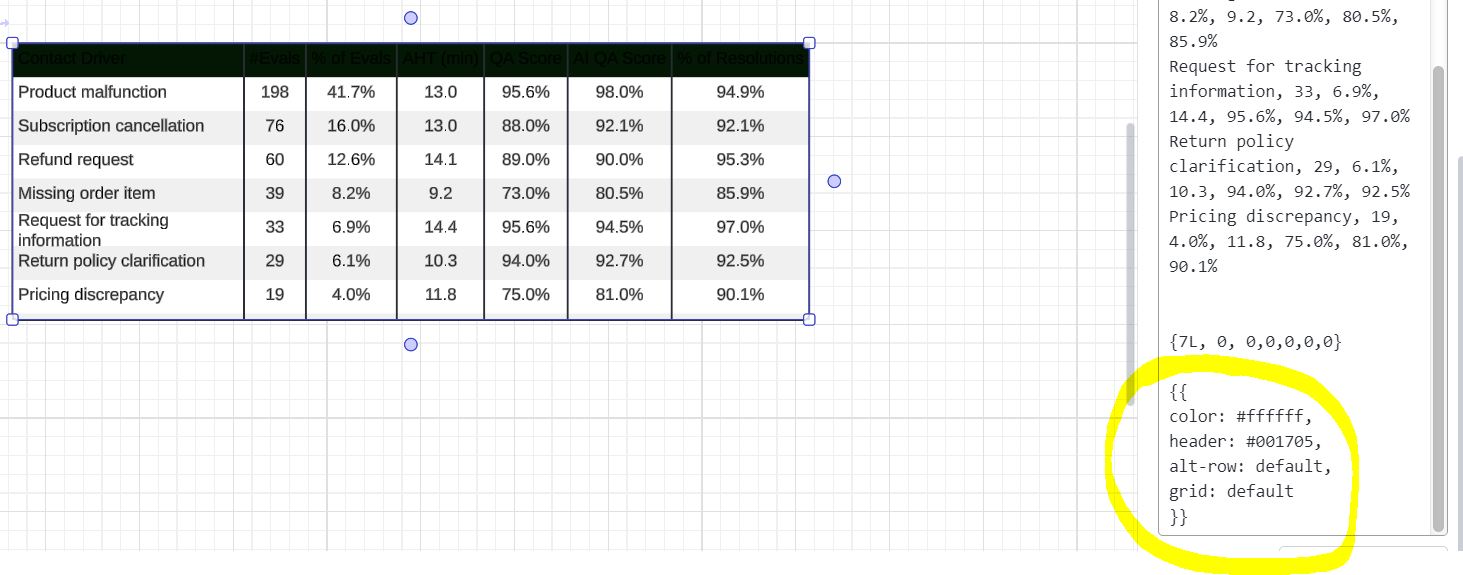
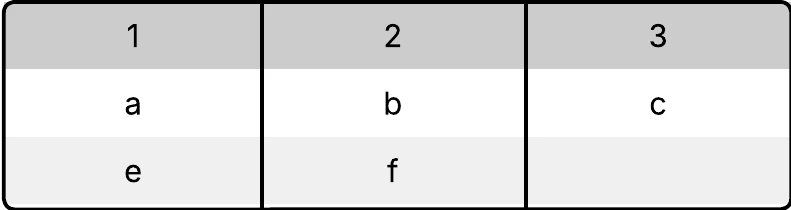
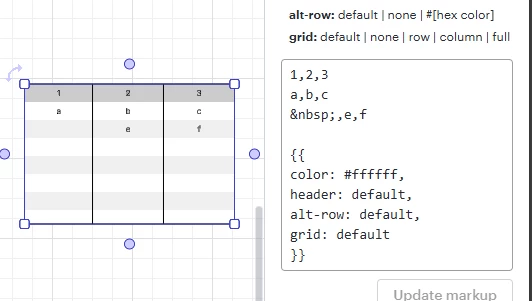
To edit the table double-click open the "Edit Markup" window. This window describes the current style options and displays an editing field that allows you to change the content and column width (1st section) and style (2nd section) of the table. Use commas to indicate the error and a line break to create a row. Adding a new line of content will input that information in a new row in the same order as seen in the editor. Text is case sensitive and using special characters will input check-boxes and radio buttons.


Can you please advise what "special character" can be used to get a Check Box to appear in a column?


Also is there documentation on each of these shapes? If so where do i find it?

Thanks for reaching out in the community. Please see the GIF below to see how to create a check box. 


Thanks. Just what I needed.


Hello do I have the ability to customize the width of each column for Table/Data Grids?


Hi Justin

Thanks for reaching out! Unfortunately that feature is not available. We're always looking for ways to improve Lucidchart and your feedback is the best way for us to do that. Would you mind adding your idea to our product feedback area of the community? This allows our team to categorize like requests and bring them to our product team. Thanks again for your request!


I have the same issue as Justin.  For a table matrix or grid with many columns and rows I need ways of managing ranges of columns and ranges of rows e.g. - column width.  I submitted a feature request form.  Until that is possible I will have to continue to use Excel.


Hi Jim


Thanks for submitting your request for this functionality. Feedback like yours helps us make an even better product.


Feel free to reach out to us anytime with questions and definitely keep the feedback coming.


Is there a way to add a check box in a real table that is data linked?  ie I'm making a task list in one of my documents. 


Hi Tucker

Great question. Enabling tick/untick boxes is not currently possible in Lucidchart but this would be a really cool feature. You're welcome to share the idea with our development team by replying here!

Thanks!


Hi, I see that there is a feature now to customize column width for Table/Data Grid using {0,0,0,3,3,3,5,4,4,3,0} format. However, is there a way to specify/customize row height?

My current wireframe table looks like this.


Hi @alma, thanks for your post! Unfortunately, this isn’t currently supported in Lucid, but we’re very interested in your feedback and committed to continually improving our products. If you’re willing to share, we’d love to hear more details about your use case or what you’d like to see in this experience within this thread. I’ve also converted this post to an idea so that it’s visible to others within the Product Feedback section of the community - from here, they can upvote it and add details of their own.

Finally, for more information on how Lucid manages feedback via this community, take a look at this post:


Hi @all 


Do you know how to change the font color of the headers, I don’t know how to do that, I would like to put them with white font but can’t find how to do it. Though “header-font” would do it but there isn’t a function like that for this


Hi @ab.jimenez

Thank you for the reply! There is currently not a way to change the header font in a Data Grid table, but we are very interested in your feedback and how we can improve our products. Feel free to add more details about your use case or what you’d like to see in this experience within this thread


Hi @ab.jimenez

Thank you for the reply! There is currently not a way to change the header font in a Data Grid table, but we are very interest in your feedback and how we can improve our products. Feel free to add more details about your use case or what you’d like to see in this experience within this thread

Thanks a lot! yeah, we are building a mockup of an App we will build so wanted to use it and show exactly the system would look like once done. Anyways was able to achieve similar using the Table with Header option.


Where are these features for this element documented?

I know that you can place an ‘L’ next to the width and this changes things but what other options are there?  if you search for this you get the Table which is not the same thing.

The time to add a feature is not well spent if you don't tell people about them and how to use it..

Thanks!
 

{L10,10,3,9,5,5,2,2,3,6}

{{
color: #ffffff,
header: default,
alt-row: default,
grid: default
}}

.


Where are these features for this element documented?

Yes, please… it’s frustrating to not have documentation on a very undiscoverable set of features. Googling for “lucid table/data grid" lands here… where piecemeal and stale information is the documentation.


Hi @Ricardo S TSN and ​@pettys, thank you for your feedback here. 

I can certainly understand why additional documentation on this feature would be helpful. I apologize for any confusion and I am passing along this feedback to the proper team. If you’d like to leave additional feedback regarding our documentation specifically, we would love to hear from you in this form if desired.

Taking a look through this thread, I am seeing that some of the screenshots and GIFs are outdated. I want to provide an updated look at this feature for any other users who may come across this post. At this moment as the style options list, you can adjust the header and alternating row colors to either default, none, or your preferred #hex color. The grid options are default, none, row, column, or full. 


We encourage anyone else who’s interested in this to upvote this post and share any additional details about your use case or what you’d like to see in this experience.


Hi All,

Is there a way to create an empty cell in the first column of the Table/Data Grid component?

1 2 3
a b c
  e f


1,2,3
a,b,c
,e,f

{{
color: #ffffff,
header: default,
alt-row: default,
grid: default
}}

When I use the above code, I end up with the table below instead of the one above:


Hi ​@Eric Moret, thanks for adding to this thread! I’ve been able to reproduce this as well. I am raising this with our product teams for them to take a closer look.

I’ll update this thread as soon as I have more information. Thank you for your patience as I look into this!


Hi All,

Is there a way to create an empty cell in the first column of the Table/Data Grid component?

1 2 3
a b c
  e f


1,2,3
a,b,c
,e,f

{{
color: #ffffff,
header: default,
alt-row: default,
grid: default
}}

When I use the above code, I end up with the table below instead of the one above:


I was trying to figure this out as well and what I came up with is a non-breaking space html entity code to show a “blank”.


1,2,3
a,b,c
 ,e,f

{{
color: #ffffff,
header: default,
alt-row: default,
grid: default
}}


Hi ​@mesquibel, thank you for adding to this thread with that information! Testing on my end, I am also able to create a space by inputting &nbsp as you described.

This thread will be updated with any new information from our product team.