
Background:


I used LucidChart's ability to import data from my PostGres database into LucidChart to create an ERD diagram.  The result was an accurate but unusable because of all the overlapping lines showing the FK relationships among the tables.  After 4 months of intermittent effort the diagram is readable. 


Now I want to add index info to the ERD diagram.  Yes I know that index info is not usually part of an ERD diagram.  If that is going to be your response then be warned that it is not a helpful response.


I have a team license.


I have read the information about importing data from a database several times -- and it does not mention anything about including a table's index information on the ERD diagram.  I've gone so far as to reverse engineer the format of the data in the import file.


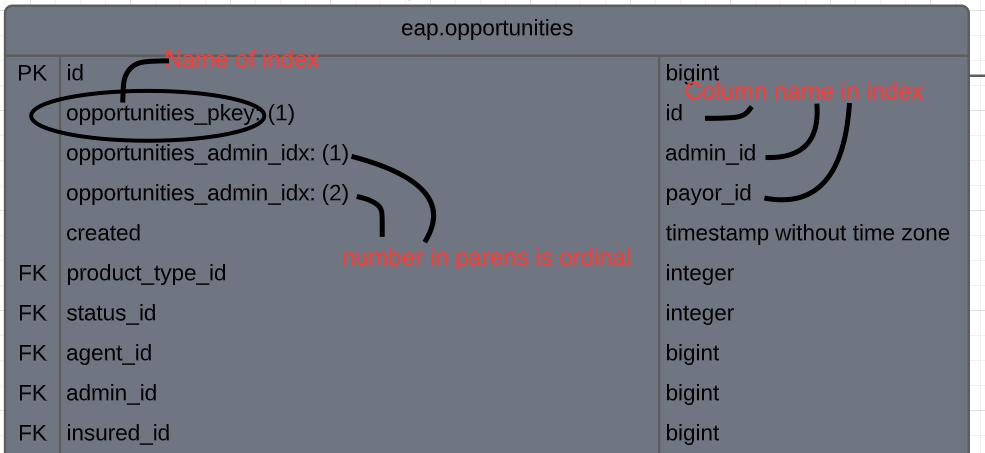
However I am looking for another way to display the index information for each table. Ideally this would be done on the ERD diagram but if the index information for all the tables could be displayed in any other kind of diagram please tell me how.


I want to find an automated way to load the index info into a diagram so that I have a diagram that I can trust and that my team can trust.  Manually updating a diagram just lets human errors creep in over time.

Hi @enelson thanks for posting in the Lucid community! Apologies for the frustration you've experienced and thanks for sharing the details surrounding your use case and what you've tried so far. Unfortunately index information is not included in Lucidchart's query for PostgreSQL databases and automatically importing and adding this information to your ERD tables isn't currently supported. If you would like to see support for this ability in the future our development team loves to hear additional detail via the Product Feedback space in this community - they consider these ideas when prioritizing improvements to Lucidchart!

In the meantime I believe your best option remains to manually add your index information to your ERD table shapes after you add them to your canvas. I certainly understand the potential for human error with that process however and so I want to share an additional potential option utilizing Data Linking. This tool allows you to import data of any kind in the form of Google Sheet Excel file or CSV file into Lucidchart then associate and visualize that data with corresponding shapes. Unlike Lucidchart's ERD tool data linking doesn't automatically generate shapes for you but perhaps the automated data import could allow for more accurate and simplified association of the index information with the corresponding ERD table as opposed to manual transcription. I recognize this workaround isn't ideal and I would like to do all I can to help you continue your work! Please let me know if you have any additional questions. 


Thank you!  This answer is very helpful!


I understand what you are saying.  It would be great if LucidChart could add the ability to get this info as part of the ERD import.


Be warned I will co-opt the ERD import to add index information.  As additional columns.  This way I avoid the data linking and can automate the info retrieval from my DB.  I was hoping for a more native support for adding index info.


Once I have it working I can provide the needed steps here.


@enelson Thanks for the response! I certainly understand how native support for this would make your diagramming more efficient - thank you so much for your request and valuable feedback here. I am glad to hear that you'll be able to continue with your ERD and add the index information in additional columns. Your workaround sounds excellent and I'm sure many other users would benefit from what you discover. Thank you for being willing to share with the community!


Please don't hesitate to reach out in the future if there's anything else we can do to support you!


I took a picture of what I was able to accomplish.  Here it is:


A quick sketch of what I did.  Note that I am using Postgres.


  1. On a blank LucidChart diagram click import data

  2. Choose the 'import ERD data from SQL database' option

  3. A query is provided to query your database.

  4. Execute the query save data to a file

  5. I created a second query to get index info back from the database.

  6. Execute the query save data to a file

  7. Merge the two files.  NOTE: I ran into a snag in getting the two queries to work together in a UNION ALL.  Unioning the the results of both queries into one result set makes this much easier

  8. Import the new data into your ERD diagram.

  9. See the screen capture above of a test table.


Thanks again @enelson! Those steps are so useful and your test table looks great!