Hi Julio
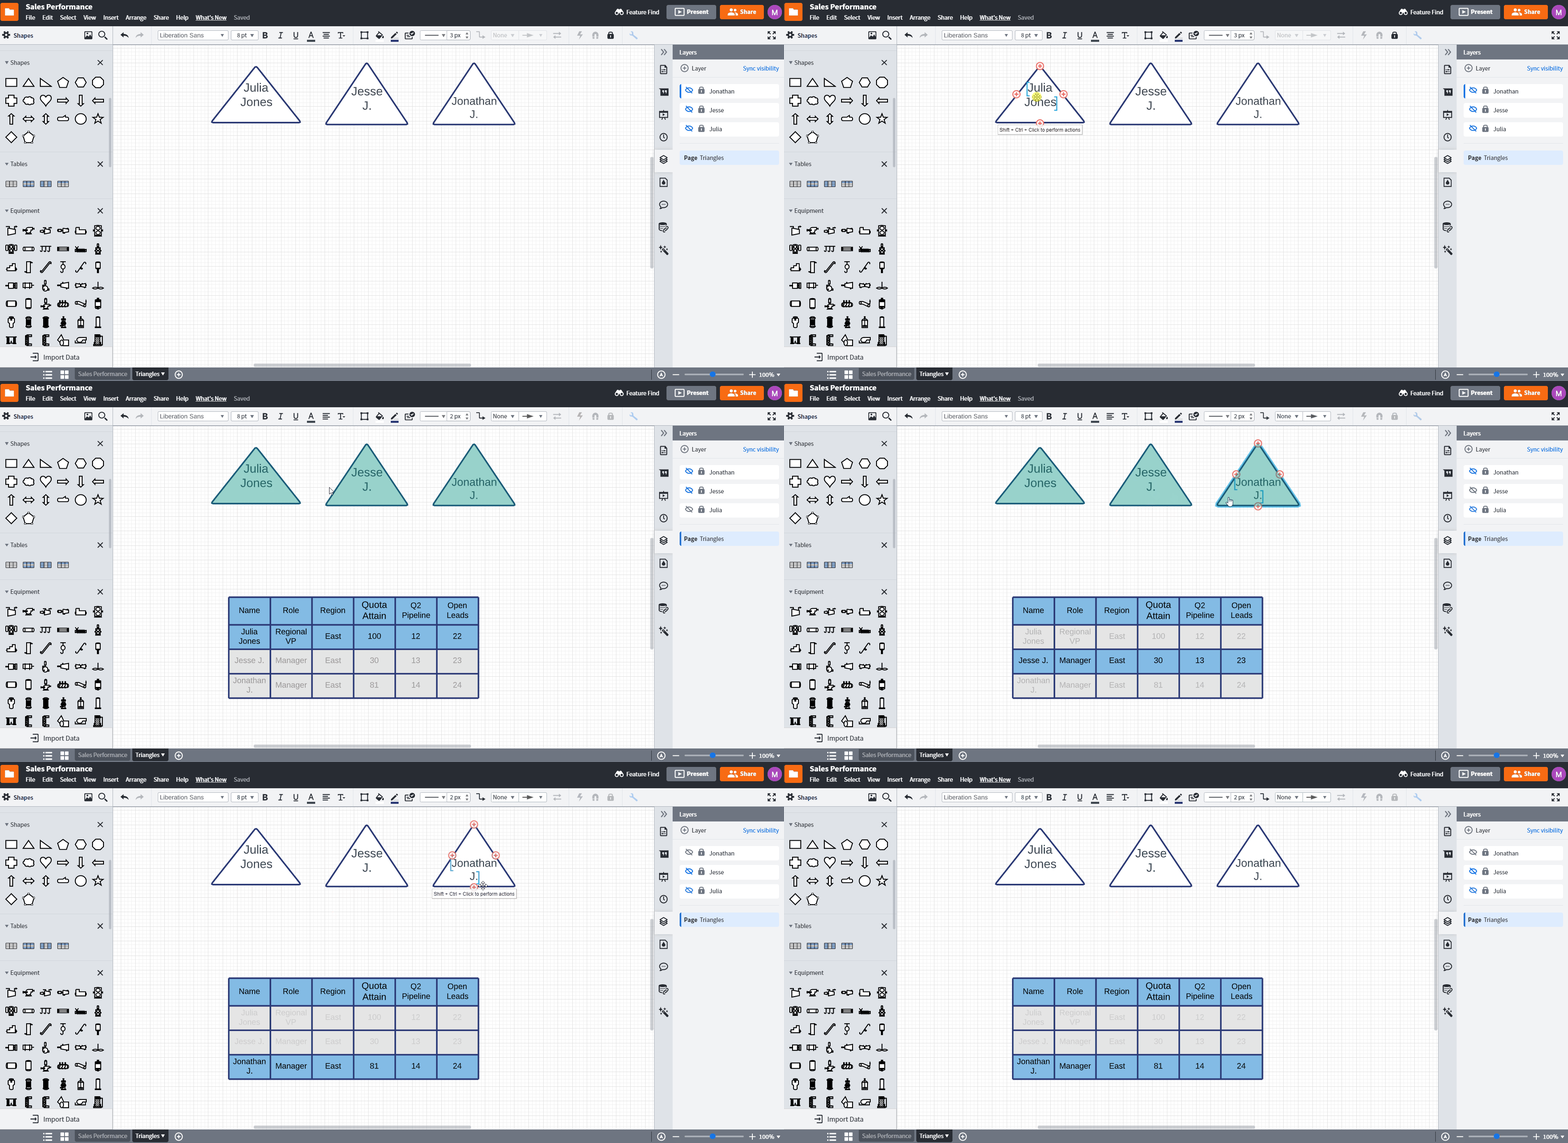
Thanks for posting in the community! Yes this is possible; one way to achieve this is using Actions/Hotspots and Layers. Please take a moment to review the linked help center articles for instructions and intended functionality. To help illustrate how you might create a document like this I've created this example with sample sales performance data below in which each triangle represents a salesperson and the table contains data related to their performance.
First I created the table (available in the Tables shape library) with a piece of data from my Google Sheet in each cell. For each salesperson I've made a copy of this table highlighted the data specific to them and grayed out the rest. Next I created a layer for each salesperson and added their corresponding table to it. Finally I associated an action with each triangle so that when I click on it it displays the layer corresponding to that salesperson and hides the others effectively showing only the data relevant to the selected shape.

I hope this helps! Please let me know if you have any questions about intended functionality or setting up your own layers and actions.
Thank you Micah. Yes! I've been using layers in order to get that functionality they work great.
Also I've been using smart table shapes and I was wondering if there is a way to sort them.
Thank you again.
Hi Julio
Glad to hear layers are working for you! By sorting them are you referring to something like ordering a certain column alphabetically? If so that is not currently possible within the smart table tool and you will need to make those sorts of changes in your data sources before importing. If you're using a Google Sheet as your data source you can make the change in your Sheet then simply click the "Refresh" button in Lucidchart to reflect those changes in your data. If I'm misunderstanding what you're referring to please let me know!
Micah sorry for the delay.
Yes I'm using Google Sheets as my data source I'd already linked all the shapes to the records in the sheet. If I sort the sheet does it affect the linking? in other words do I have to re-link the records to the shapes after each sorting?
Thank you.
Hi Julio
It won't effect the linking! Simply make the changes in your Google Sheet and click the Refresh button - you should see the updates in the data without having to re-link your shapes. Let me know if you have any trouble with this!
