Hi Emma
Thank you for posting this question in the Community! You can use containers to group Jira cards together and calculate their values. I'll outline the steps below using story points as the summed value.
For convenience we'll start in Lucidspark to add Jira cards and choose a container then using universal canvas we'll move to Lucidchart to add formulas to the container and visualize with dynamic shapes.
Start in Lucidspark:
1. Add Jira Cards
2. Add your container of choice
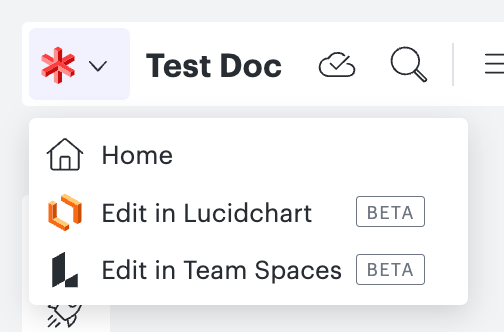
Now use Universal Canvas to move to Lucidchart!
In Lucidchart:
1. Open the Contextual Panel for the container shape to add a custom data field. Use the CONTAINED formula to sum the values of Jira cards within the container.
Formula: =Sum(CONTAINED."Story Points")
2. Add or remove Jira cards from the container and observe that the displayed sum will automatically update!
Want to take it a step further?
Use dynamic shapes to visualize Jira Card values within a container
1. In order to reference the container shape in our next formula we'll need to copy the automatically generated shape name of the container. Open the contextual panel for the container shape a second time create another new data field and use the following formula to get the automatically generated name of the shape:
Formula: =LABEL(THIS)
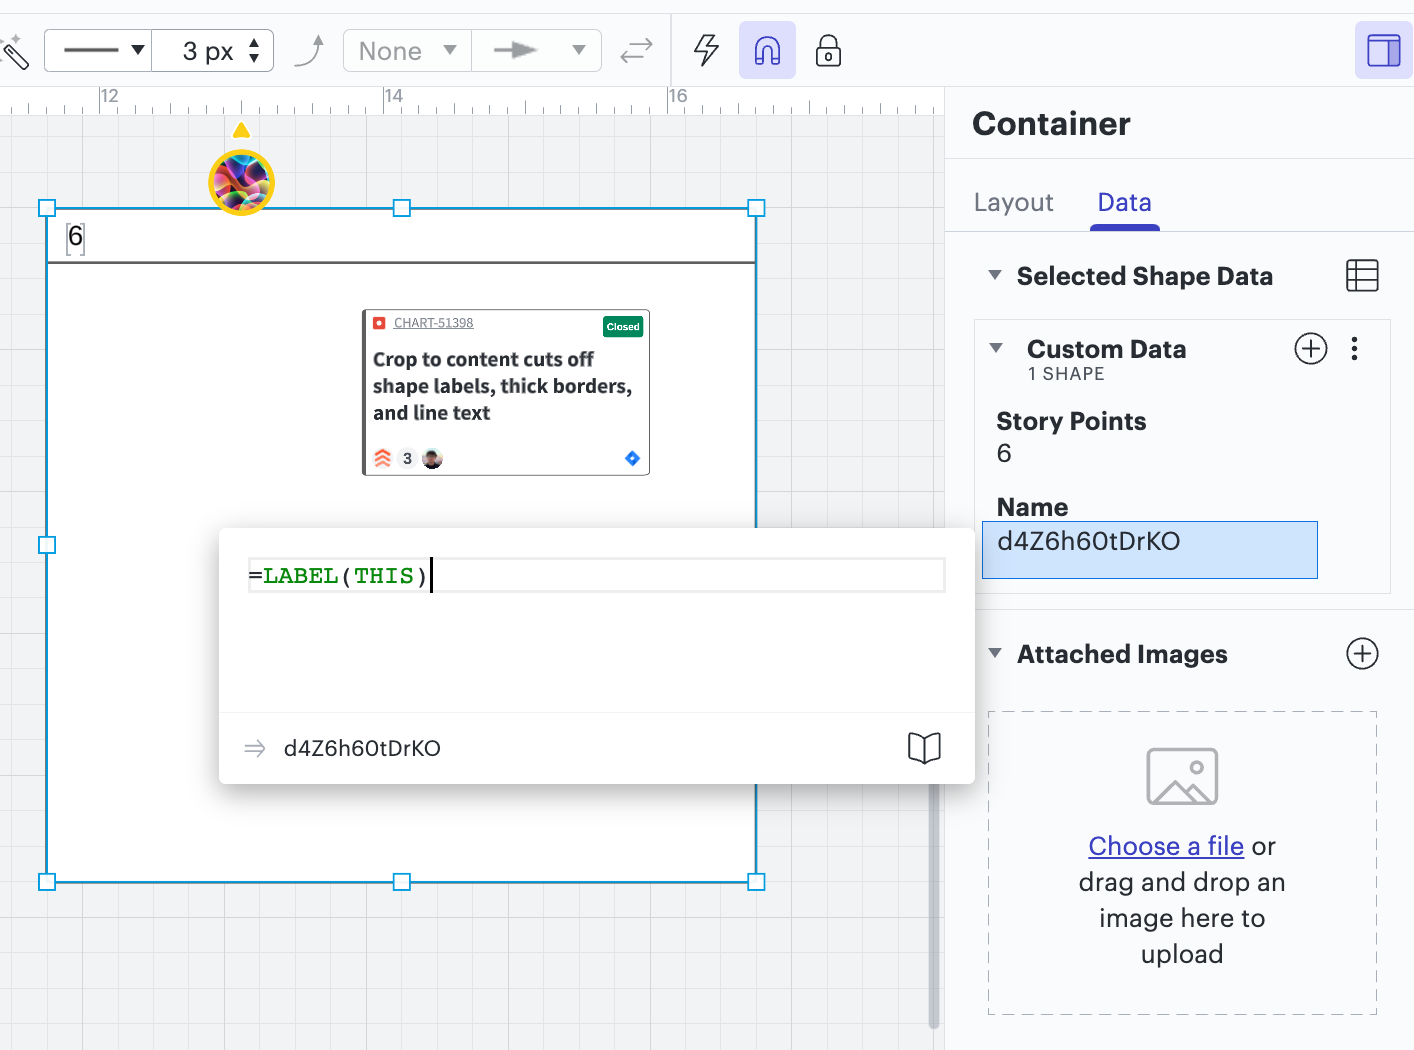
Copy the shape name (in this example the shape name that was generated is d4Z6h60tDrKO) You will paste it into the next formula with your dynamic shape!
2. Select a dynamic shape open the contextual panel and add the following formula as a new data field:
Formula: =findshapebylabel("insert the shape name from above")."Story Points"
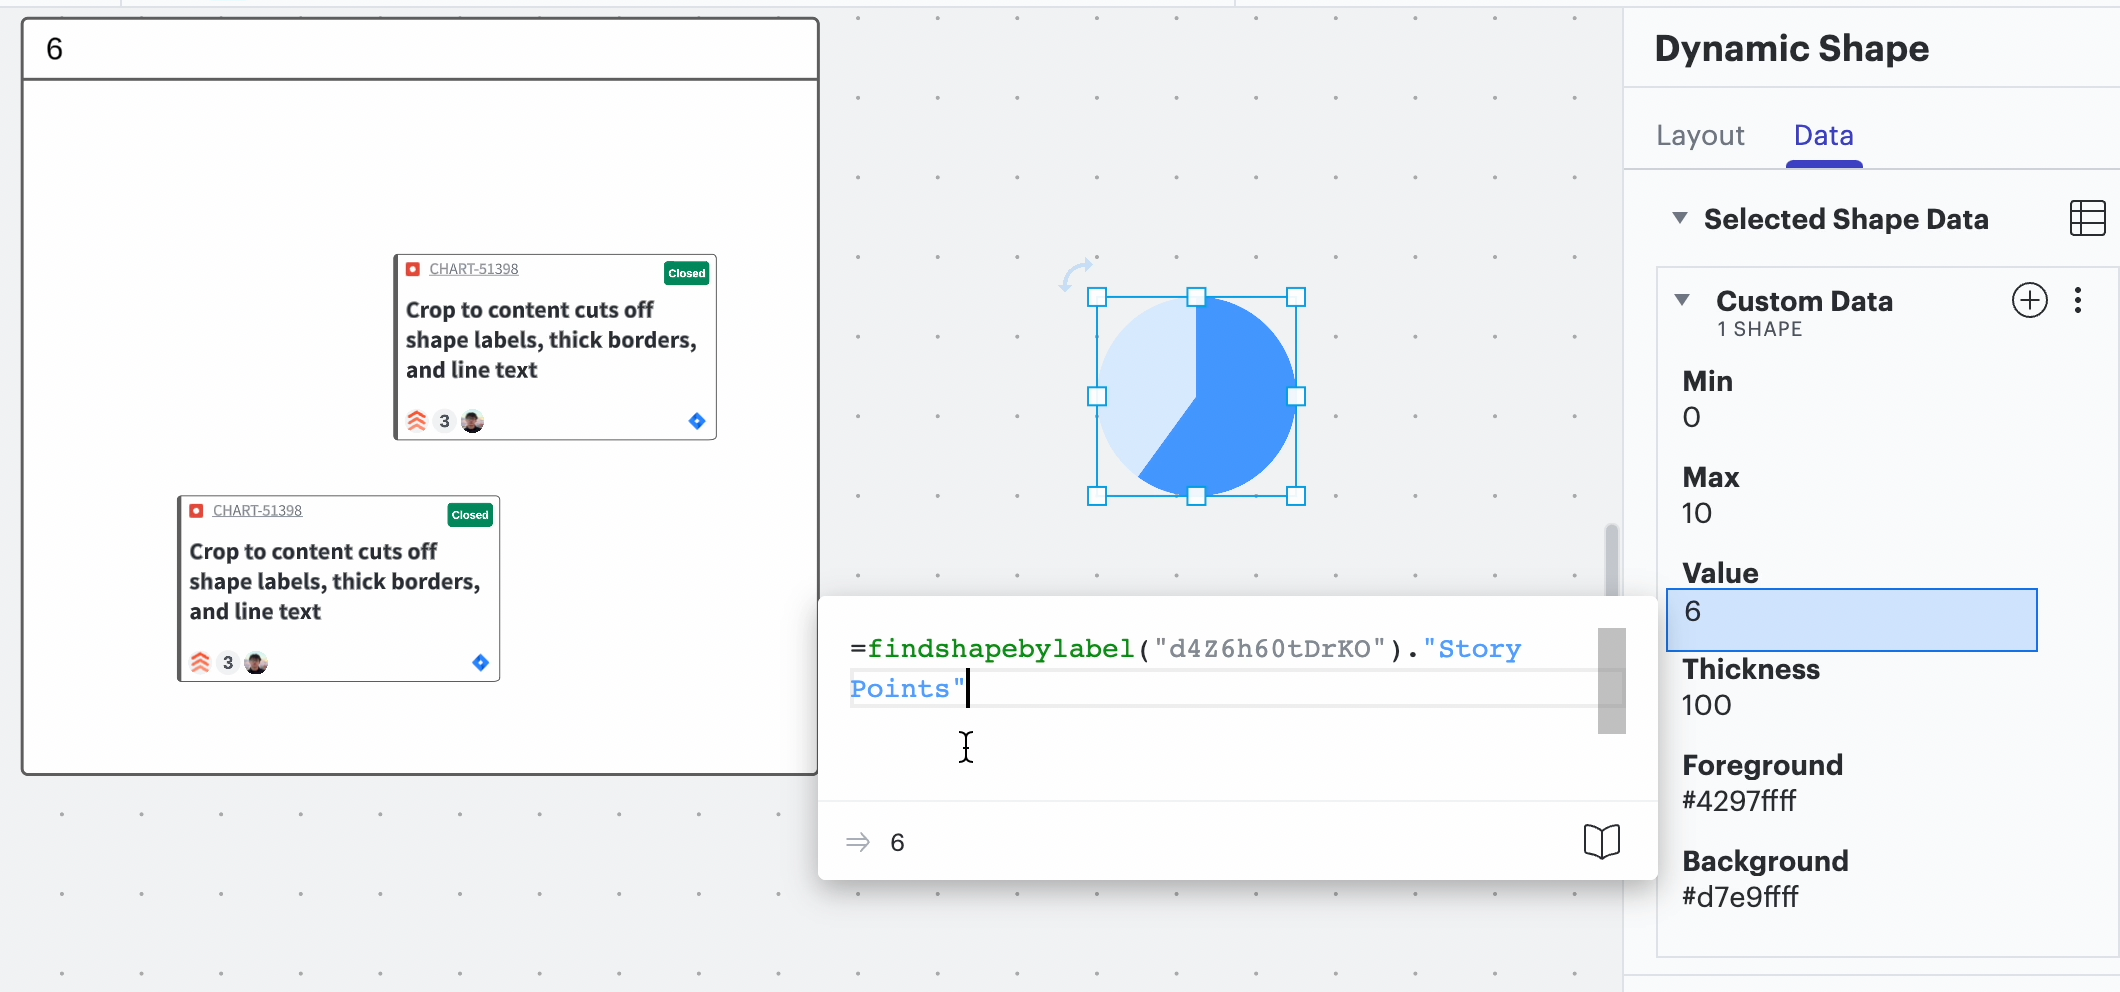
The dynamic shape will reflect the total values of the Jira cards within the container!
I hope this is helpful! Please let us know if you have any additional questions.
Thank you this was very helpful! This is exactly what I want to do. I am having one problem. When I use the "Contained" function nothing is showing up. It's not recognizing "Story Points" with 'CONTAINED."Story Points"' but it's also not even returning an array of Jira cards when I just enter "CONTAINED" even though there are several Jira cards in my container. I have tried with several different non-smart container shapes. Is there a reason the contained function might not be recognizing my container or cards?
Thank you!
As a side note I was looking for the "CONTAINED" function on your Lucid Formulas page but couldn't find it; are there other places where this information is located as well?
Hi Emma
I'm happy to hear this was helpful! We'd be happy to take a closer look to see what might be going on with your formula. Do you mind sharing a screenshot of your board that shows the formula you're using?
Additionally thank you for pointing out that this formula is not yet included in our documentation - I'll pass this feedback along to our development team!
Hi Addie
Thank you for your help; it is working much more smoothly now!
Wanted to briefly post about the resolution to the cards not showing up through the formulas: I went back and tried to recreate the error but wasn't able to - the formulas had started working. Later on I ran into the same error where it was recognizing some cards and not other cards. I realized that the formulas picked up on the cards that I imported after I added the formulas but not the ones that were already on the board. Reloading the page didn't help but converting the board back to lucidspark and then again to lucidcharts made the forumlas recognize the cards.
Thank you for your help with this tool! It's working really well and I'm excited to see how it will be used.
Hi Emma
I'm happy to hear you were able to work it out! Thank you for sharing your insight on how you were able to resolve the issue. Please reach out if you have any additional questions and if you'd like we'd also love to see how you end up designing your board!
Hi! I’m Micah from Lucid’s community team. 👋 I thought you, and any others who might come across this topic in the future, might be interested in Lucid’s Data Trusted User Group. This group is made up of knowledgeable users who regularly analyze and visualize data in their work. As part of this group, you’ll have the opportunity to connect directly with Lucid’s product team, gain early access to beta features, and share insights about your needs, shaping the future of Lucid’s data solutions 🎉 You can learn more and request to join here. Thanks!