hi is it possible to do a conditional formatting to have a specific line color between shapes?
for example is shape = switch and shape = server then line = blue
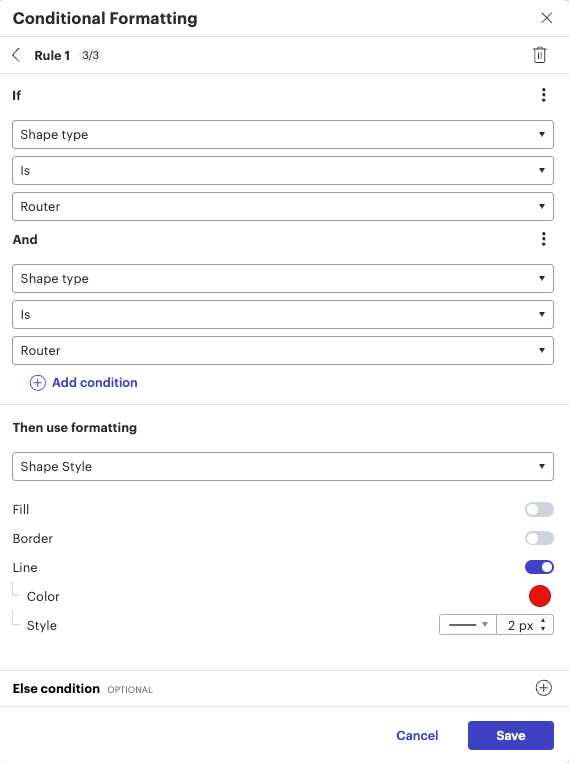
if shape = router and shape = router then line is red
hi is it possible to do a conditional formatting to have a specific line color between shapes?
for example is shape = switch and shape = server then line = blue
if shape = router and shape = router then line is red
Hey
Thank you for your help and patience!
this is what i tried. but doesnt seem like my lines between routers change
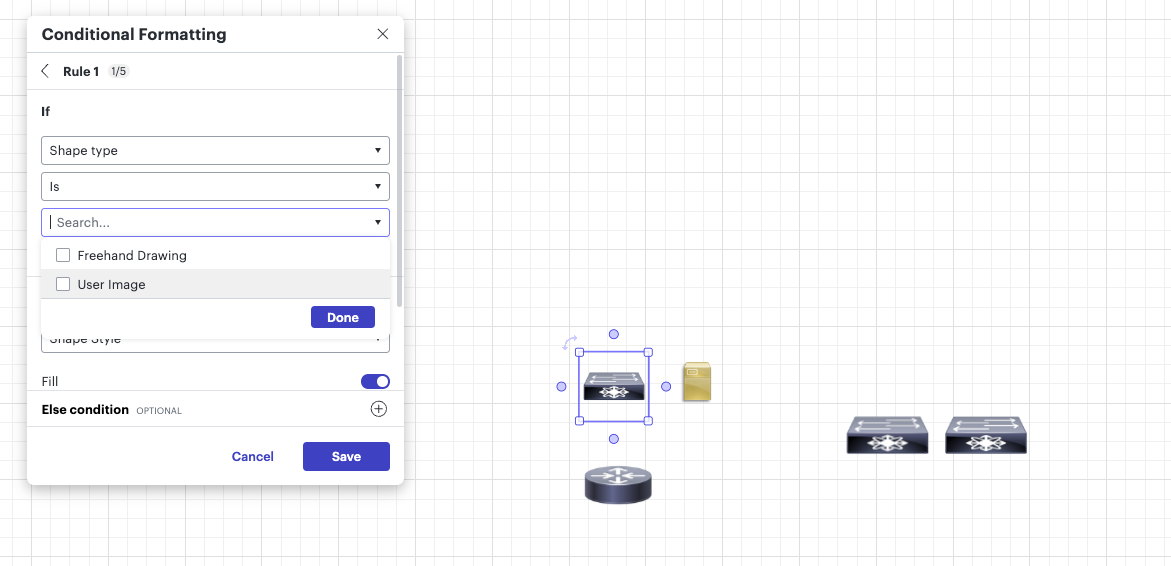
also i just noticed with a shape that i imported i cannot select it as a shape type
Hey
=contains(shapetype(upstream), ‘ProcessBlock’)
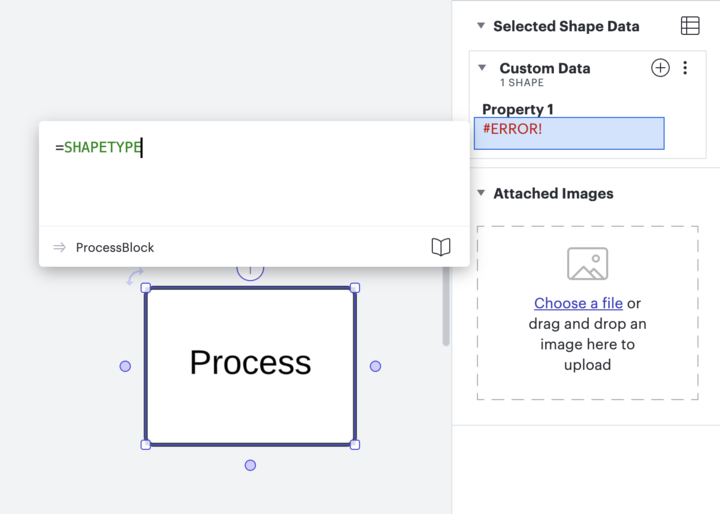
Process is the shape type that I used for my example, however, you will need to know the type of shape that you’re using. To find that out, click on the shape, navigate to the right side panel and under property one, type the formula:
=shapetype
Once you have all of your “if” statements clarified for all the shapes, you can then move down to the “then” statement and make the line colors what you would like them to be.
Hope this helps!
Hey
=contains(shapetype(upstream), ‘ProcessBlock’)
Process is the shape type that I used for my example, however, you will need to know the type of shape that you’re using. To find that out, click on the shape, navigate to the right side panel and under property one, type the formula:
=shapetype
Once you have all of your “if” statements clarified for all the shapes, you can then move down to the “then” statement and make the line colors what you would like them to be.
Hope this helps!
how would this work to make sure that if i have 2 shapes say like a source shape and destination shape then put this line
also how come my custom shapes dont show up in the conditional formatting ?
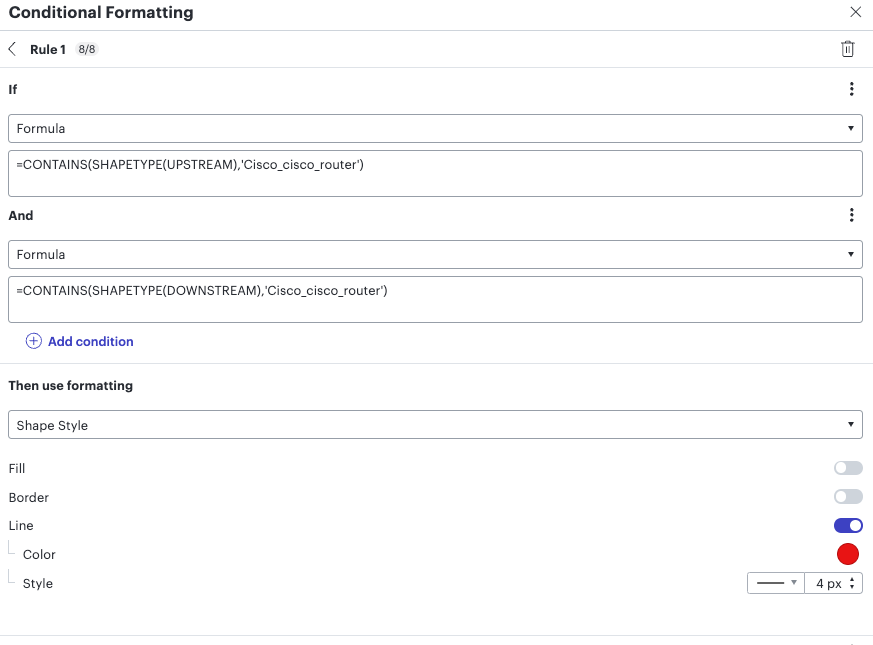
Hey there -- thanks for the reply! So, you’ll need to change the shape in your formula for each shape you’d like to change the line color for. For example, if it’s a source shape it would be
=contains(shapetype(upstream), ‘sourceshape’)
From there, you’ll change the line within the conditional formatting to be whatever color you’d like it to be.
As for your second question, if you do have a custom shape that you’ve uploaded, it may not appear in the Shape Style within the preset conditional formatting, however, you should be able to utilize this same method I’ve mentioned above to create a formula that works for your use case.
Hope this helps!
looks like i was able to get it to do what i want with this, is it possible to make it automatically put the line between the routers?
how can i change the shapetype property of a shape? my custom shapes have some random type
Hey there,
Thank you for the reply and I’m glad that works for you! Great question, however, I believe the best option here would be utilizing the method I’ve shown above for identifying the shape type and then using that information to create your formula.
Hope this helps!
Hey there,
Thank you for the reply and I’m glad that works for you! Great question, however, I believe the best option here would be utilizing the method I’ve shown above for identifying the shape type and then using that information to create your formula.
Hope this helps!
So there’s no way to edit the shapes data? or add new data? such as shapetype
Hey
=contains(shapetype(upstream), ‘Type’ ‘whatever your type is called’)
It should look something like this on your right side panel:
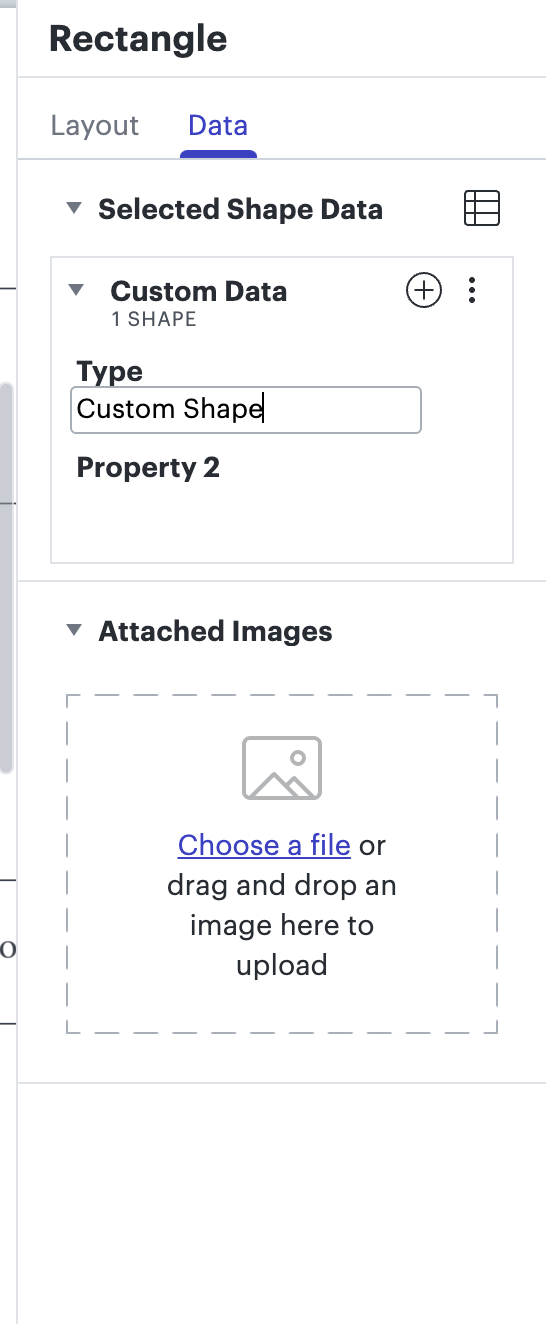
Hope this helps!
thank you, is there documentation on th custom data and what fields can be created?
Hey
Hope these help!
Hi
A Lucid account is required to interact with the community. You will be redirected to the Lucid app to create an account.
A Lucid account is required to interact with the community. You will be redirected to the Lucid app to log in.
Enter your E-mail address. We'll send you an e-mail with instructions to reset your password.