Can I import a spreadsheet (or .csv) and have Lucid automatically generate a flow diagram to my specifications?
- The flow diagram demonstrates a simple journey - from start to finish.
- The flow diagram consists typically of between 60 and 90 individual steps.
- Each step can be connected to one or more other steps.
- e.g. step 1 could connect to step 2 and 3
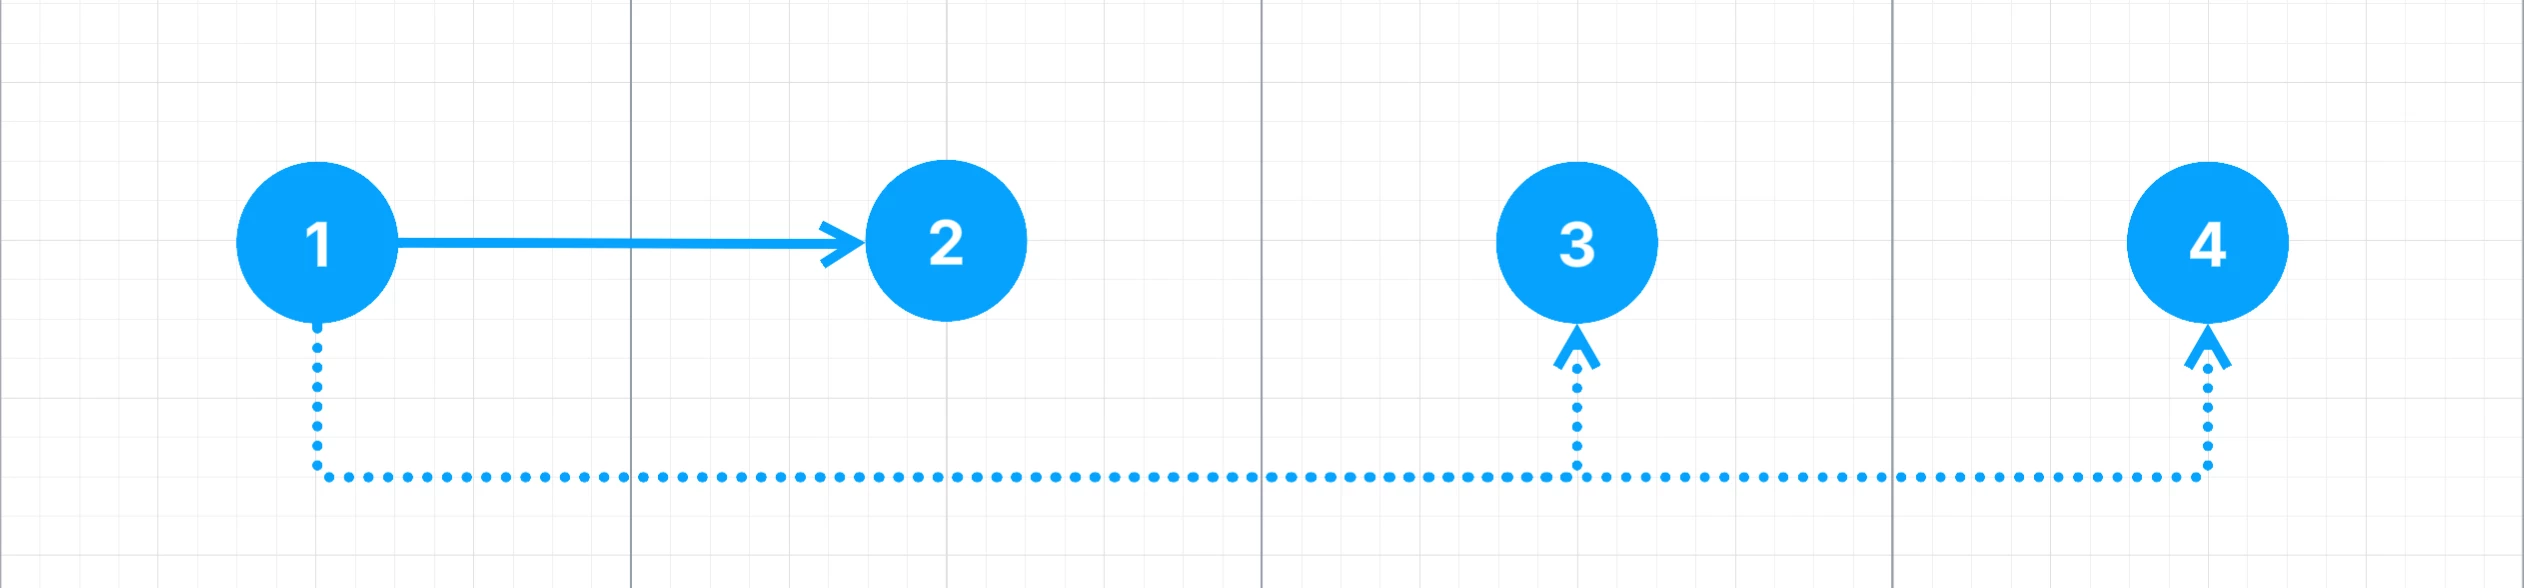
- The connections between steps can be primary or secondary and indicated with two line types: primary - solid, secondary - dotted.
- e.g. step 1 could connect to 2 as primary, using a solid line, and step 3 as secondary, using a dotted line.
- The data expressing what step is linked primarily and secondarily to which steps is held in a spreadsheet
- e.g. step, primary, secondary
- Step: Each row has the number of the step: 1, 2, 3, etc.
- Primary: Shows which step the current step should link to using a solid line: link to Step 2
- Secondary: Shows which step the current step should link to using a dotted line: link to Step 3
- e.g. step, primary, secondary
- It is common that there can be more than one connecting step for both primary and secondary.
- e.g. step 1 could link primarily to 2, yet secondarily link to 3 and 4.
- therefore Step: 1, Primary: 2, Secondary: 3,4
Whilst I have other aspects that I would like to programmatically see achieved - such as the colour and shape of the step, and colour of the connecting lines - as well as a uniformed distance between each step - maintaining a straight row where possible, if I can automate the main tasks outlined, that would be a huge win.
My goal after this is to then embed the results into a spreadsheet, where each step sits comfortably in the column width.
Any help would be most welcome. Ideally before I spend ages building 7 of these journey maps by hand.