The templates are such an amazing feature. But often when I try a new one, it looks like there’s a data source associated with it. I start clicking around looking for it, I google for an answers and fine only seemingly out-of-date instructions and training components, then I give up and wish Lucid worked better.
Please someone tell me how to find the existing data source in Lucid Spark, and where to find it in Lucid Chart?
Best answer by Micah
Hi @anyname, thanks for this question, and my apologies for the frustration. I would love to help you with this! So that I can provide you with the most precise information possible, would you please share the name and screenshot of the specific template(s) you’re working with?
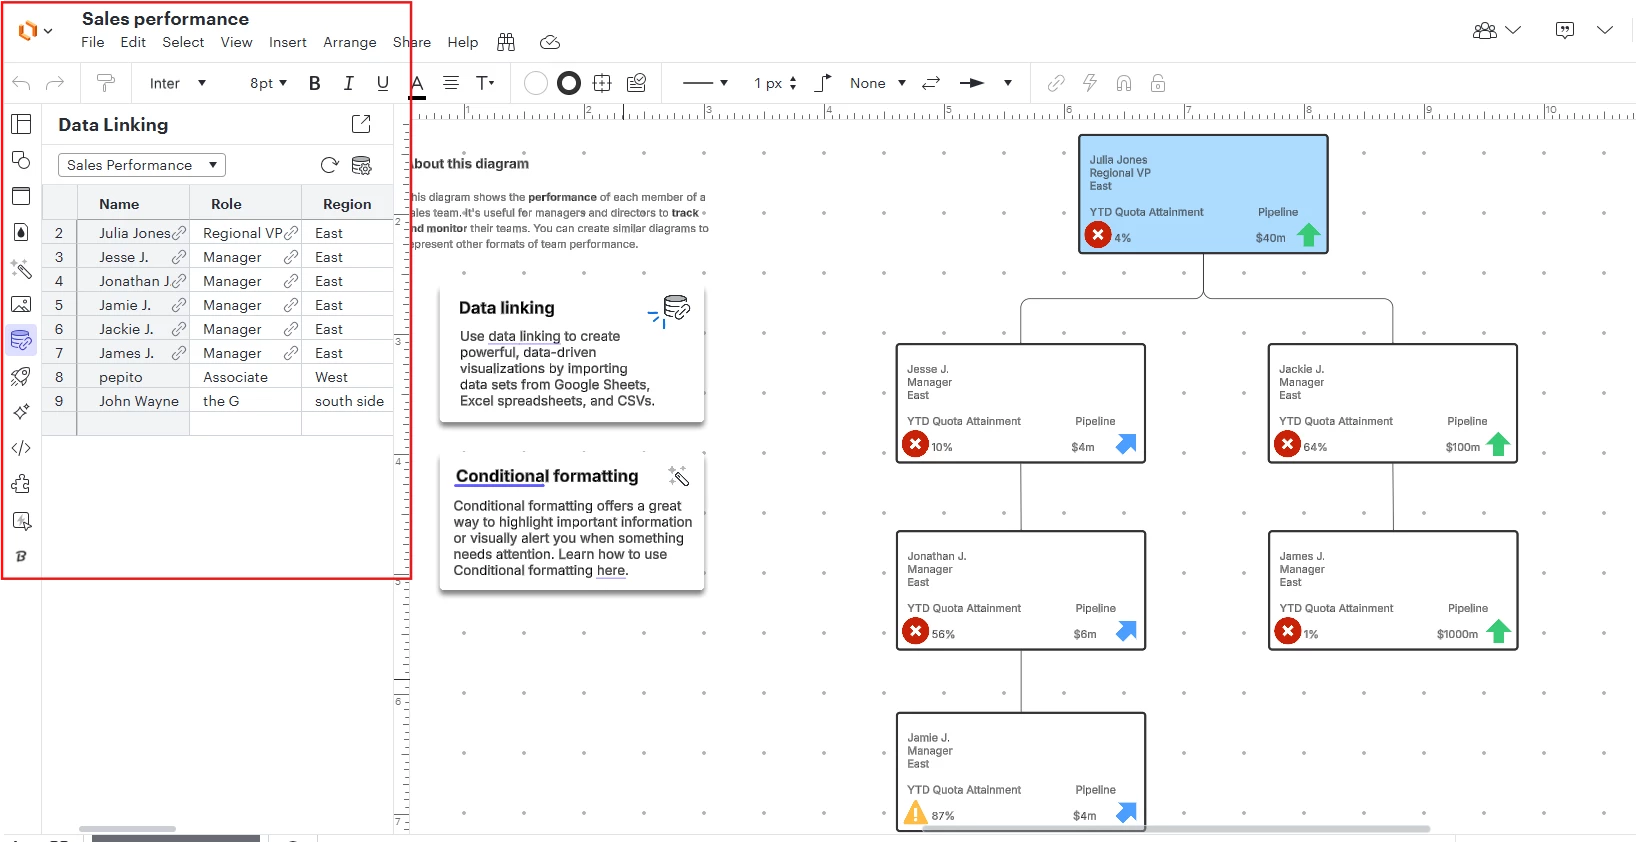
In general, in Lucidchart you can find any data associated with your diagram in this Data panel at the left of your editor:
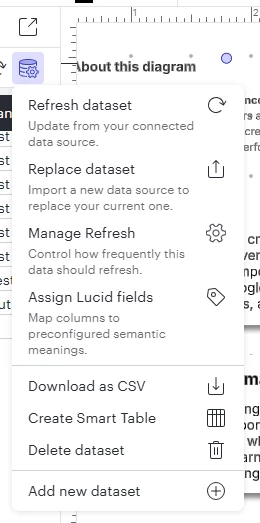
All tools to manage this data, including deleting it or replacing it entirely to make the template your own, can be found in the Manage Data menu:
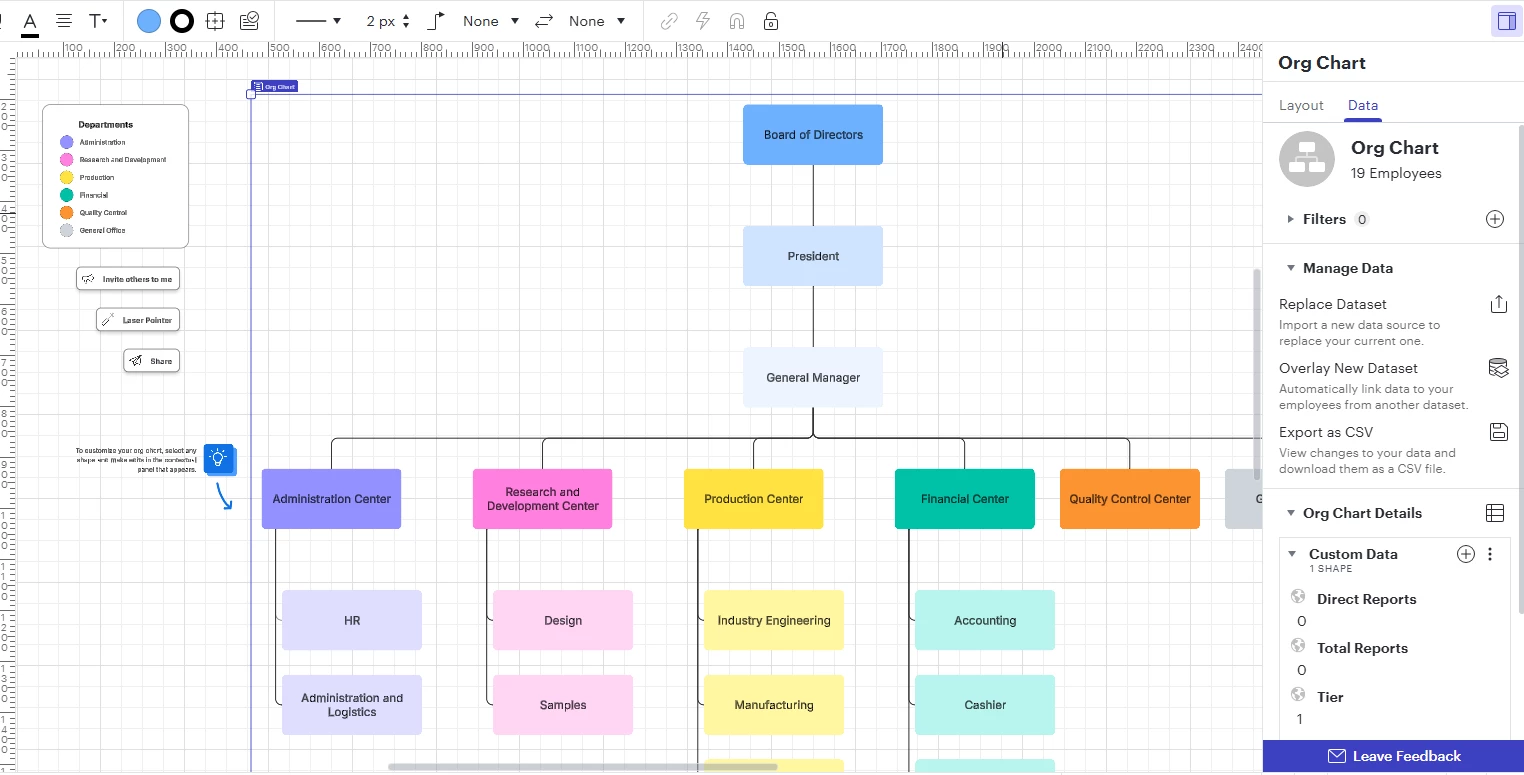
I’ll also note that some special types of diagrams in Lucidchart have separate, feature-specific data management menus which appear in the Contextual panel on the right side of the editor. An example of this is org charts:
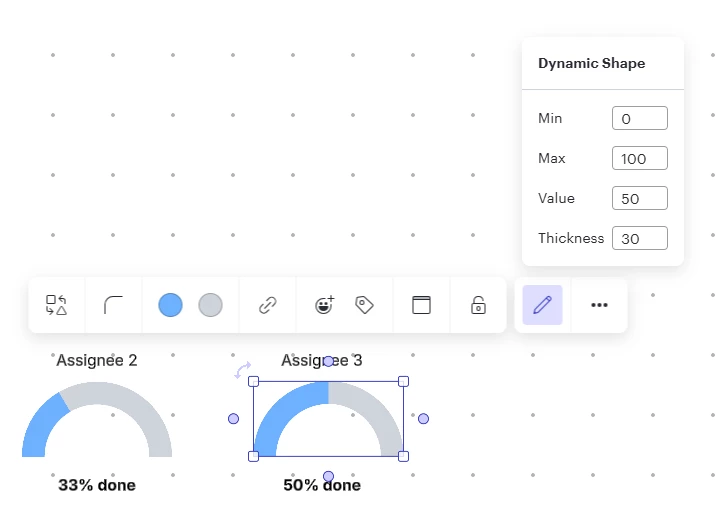
In Lucidspark, data is most often associated with the specific shapes or integrations you’re working with. For example, this dynamic progress bar in this template allows me to input data directly:
Hi @anyname, thanks for this question, and my apologies for the frustration. I would love to help you with this! So that I can provide you with the most precise information possible, would you please share the name and screenshot of the specific template(s) you’re working with?
In general, in Lucidchart you can find any data associated with your diagram in this Data panel at the left of your editor:
All tools to manage this data, including deleting it or replacing it entirely to make the template your own, can be found in the Manage Data menu:
I’ll also note that some special types of diagrams in Lucidchart have separate, feature-specific data management menus which appear in the Contextual panel on the right side of the editor. An example of this is org charts:
In Lucidspark, data is most often associated with the specific shapes or integrations you’re working with. For example, this dynamic progress bar in this template allows me to input data directly:
A Lucid or airfocus account is required to interact with the Community, and your participation is subject to the
Supplemental Lucid Community Terms.
You may not participate in the Community if you are under 18. You will be redirected to the Lucid or airfocus app to log in.
A Lucid or airfocus account is required to interact with the Community, and your participation is subject to the
Supplemental Lucid Community Terms.
You may not participate in the Community if you are under 18. You will be redirected to the Lucid or airfocus app to log in.