
Written by UW Orbital, Student Design Team under the Faculty of Engineering at the University of Waterloo
Template: Data Flow Diagram Template
Video: Why we use Lucid to create software architecture diagrams
Detailed Walkthrough
As a part of the University of Waterloo’s Student Design Teams, UW Orbital creates Low Earth Orbit Satellites for the Canadian Space Agency’s CubeSat Design Challenge! One important aspect of Satellite development is developing the software for the Satellite’s Firmware and Software for the Satellite’s ground station. The following sections list out some of the problems we’ve faced in the past and how Lucid helped us solve them!
Efficiency and quality
Problem: Efficiency when creating high-quality diagrams and flow charts.
Lucid Solution: LucidChart is specifically designed to create complex diagrams with its built-in charting features! Simple features like arrow placement are well-thought in order to maximize user efficiency by allowing seamless connection between multiple chart elements. With the stylization and formatting options, the charts end up looking great no matter how big they get!

Centralization and Integration
Problem: Centralization and Integration with our diagramming.
Lucid Solution: Lucid Provides a lot of export formats and integrations that allow us to use our visuals in multiple places!

Diagramming with Lucid
So far with Lucid, we have created and are in the process of creating diagrams as listed out below…
List of types of diagrams you created using Lucid
-
Software Architecture (Currently in migration)
-
Controls Diagrams (Currently being planned)
-
Electrical Diagrams

-
Concept of Operation Diagrams
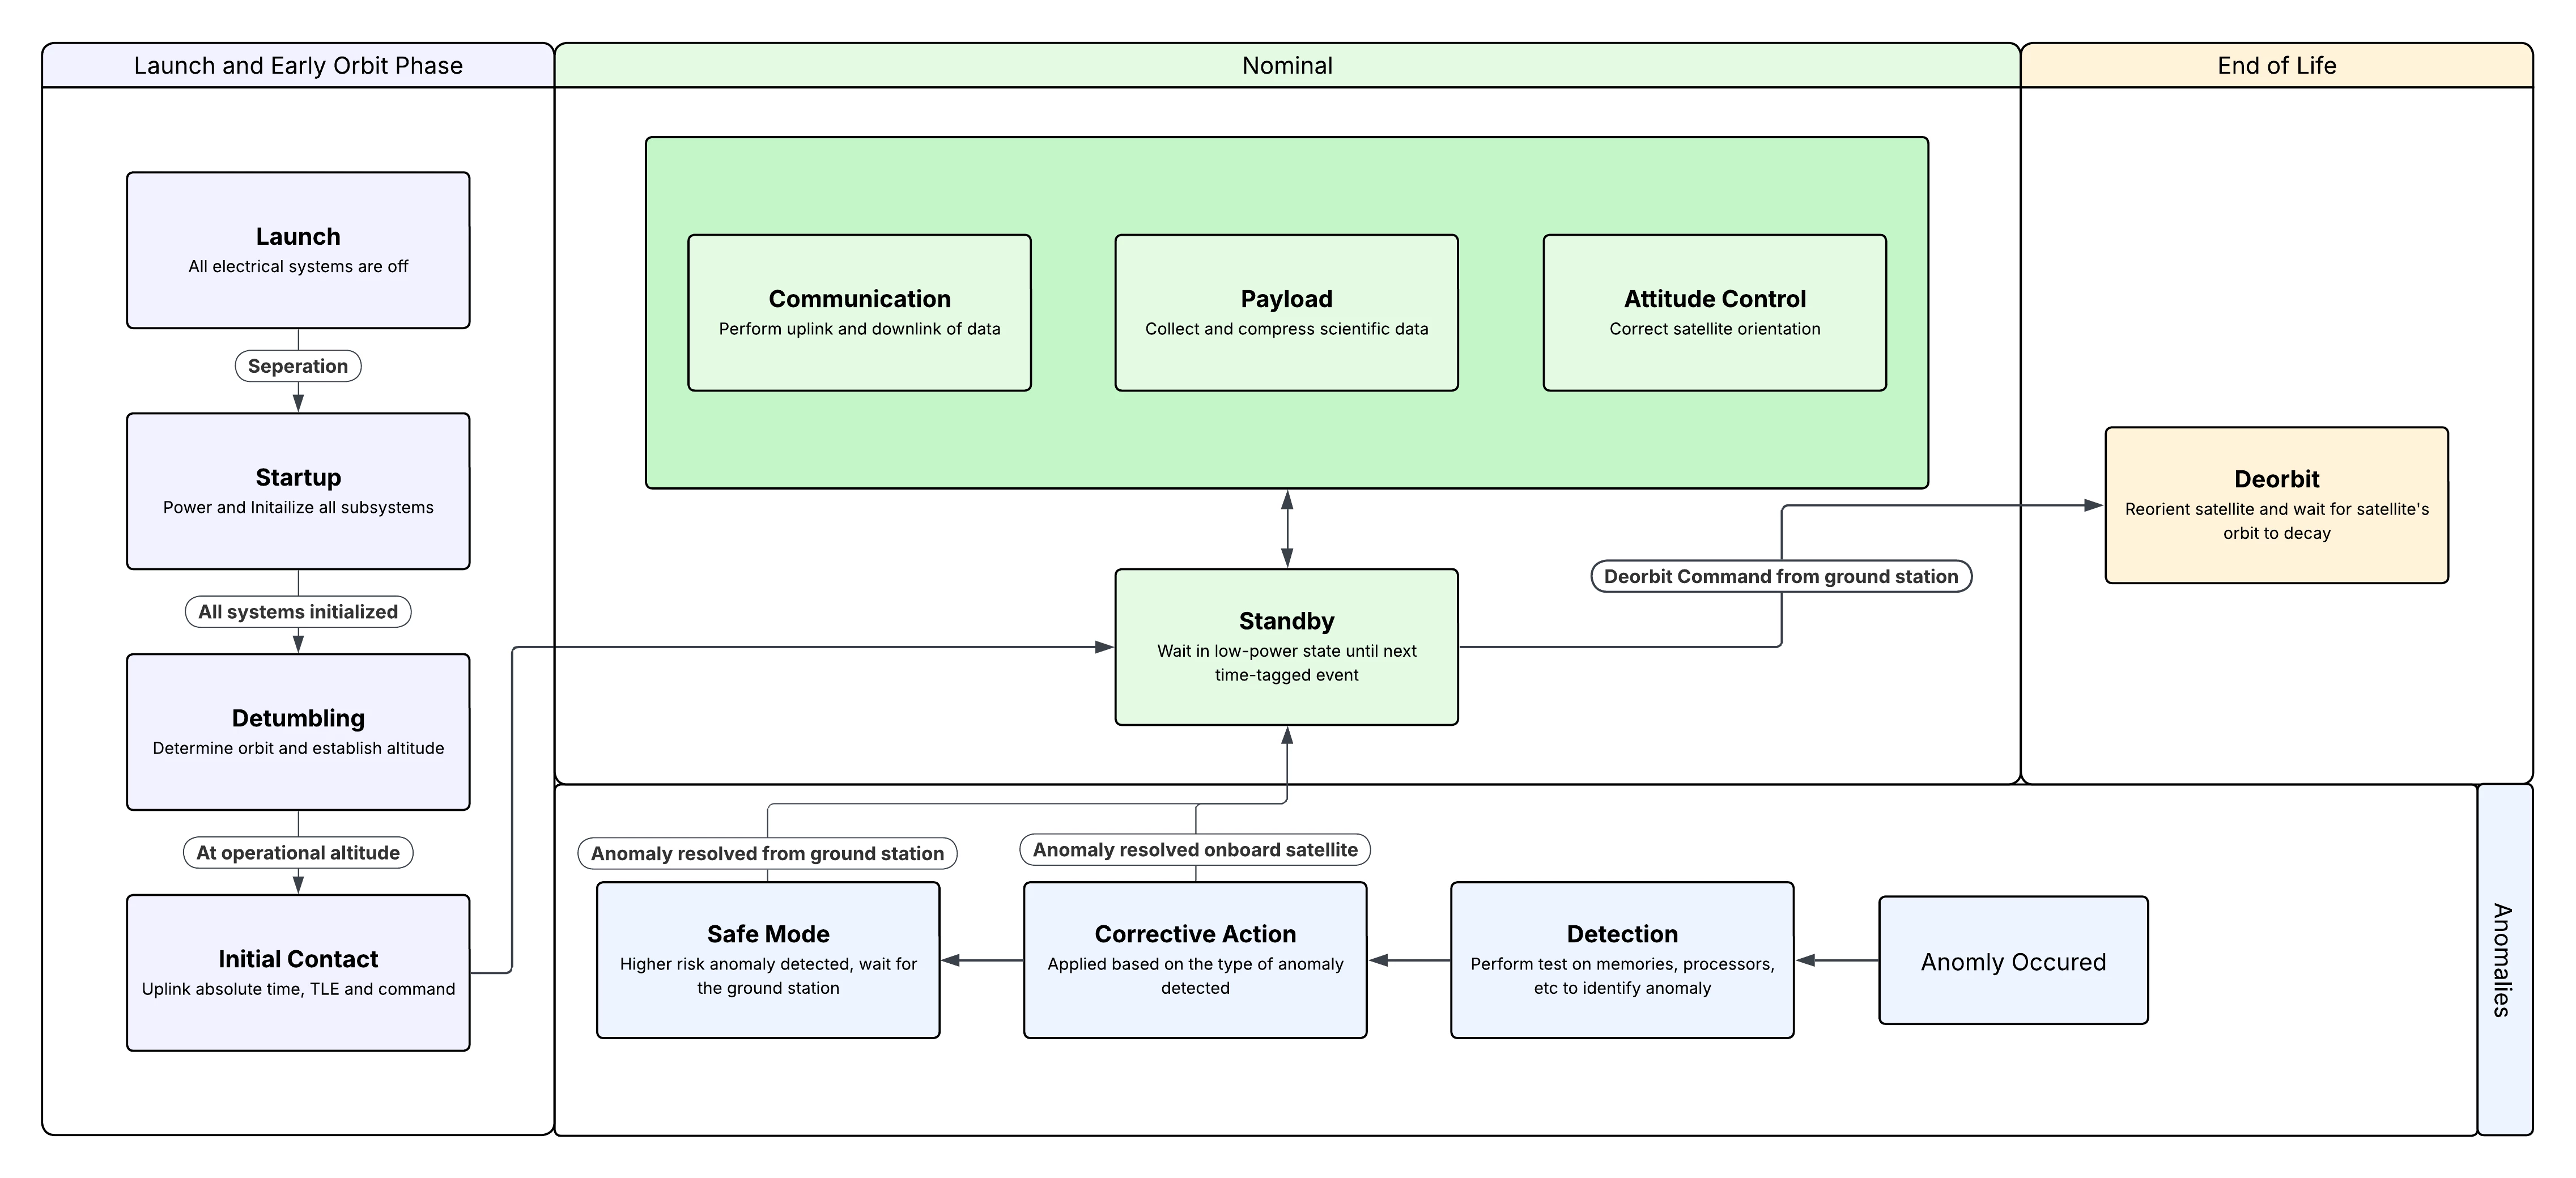
Of course, there are many more diagrams that need to be migrated/planned, however, these set of diagrams provide a solid foundation for the team’s vision and goals. We are grateful for the Lucid suite of software making this process efficient and seamless!