The possibilities with Smart Containers are endless! While the inherent flexibility of Smart Containers makes it possible for you to customize how to use them it also makes it more difficult to grasp the full potential of the feature. When the sky's the limit where do you begin?
First build a spreadsheet for your marketing campaign.
Often organizing a marketing campaign means breaking down large projects into smaller tasks and then delegating these tasks to sub-teams or individual team members. These smaller tasks usually end up in a spreadsheet which looks something like this: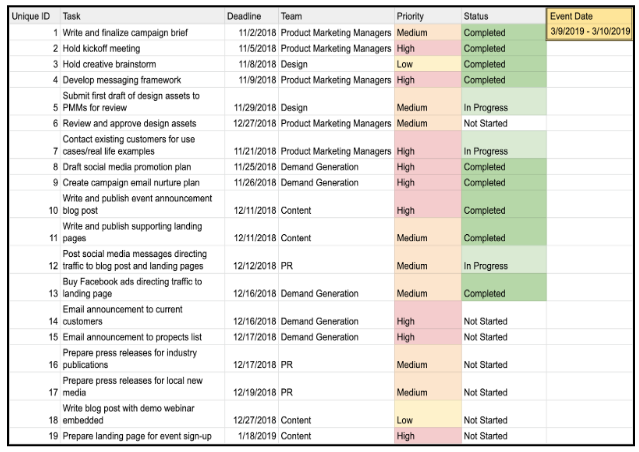
These large spreadsheets often act as the center for information but it is often tedious to find information quickly and difficult to rearrange the spreadsheet’s format. Smart Containers go further and provide the tools to visualize and organize data. Lucidchart lets you import existing spreadsheets.
Next separate your information into Smart Containers.
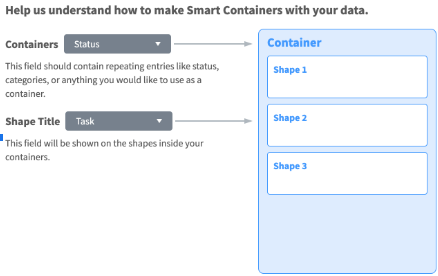
To determine how your data is organized you’re asked to choose a “containers” field and a “shape title” field from your spreadsheet. Therefore if you want to separate tasks by status then you would make the following selections:
Now you can quickly and easily manage your marketing campaign.
In this example you can easily differentiate the tasks which need immediate attention from those which are already being taken care of by another team member because the tasks are divided into separate containers according to task status.

You can also invite your team members to collaborate directly on the Lucidchart document to ensure that everyone is on the same page.
Once a task is completed team members can simply drag the task from the “Not Started” or “In Progress” containers and drop it in the “Completed” container. Rather than wasting time trying to track down your team to stay up to date with the campaign anyone can glance at the Smart Containers to calculate progress and find what to work on next.
Want to make it even more detailed?
Furthermore conditional formatting allows you to add even more layers of complexity to your Smart Containers. Let’s say you want to prioritize what to focus on within each container. In this example three unique border styles are used to indicate a task’s priority as shown in this legend: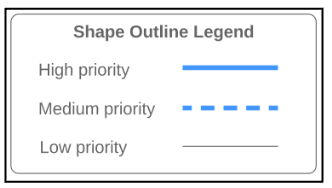
Instead of manually referencing the spreadsheet and then changing the border style for each individual task you can automate this process through conditional formatting rules.
Three rules are used in this example – one rule for “high priority” tasks one rule for “medium priority” tasks and one rule for “low priority” tasks:
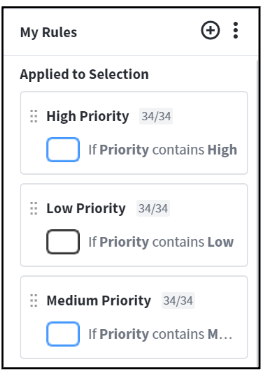
Specifically the “high priority” rule looks like this:
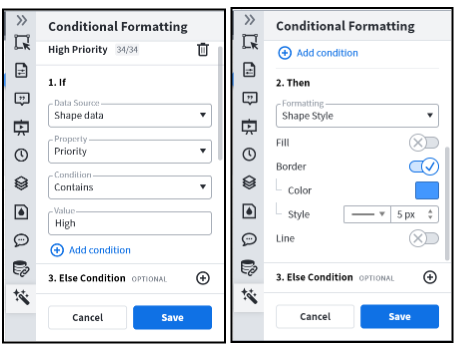
These rule settings indicate that any tasks with the “Priority” set to ““High” in the spreadsheet should have a blue 5px border with a filled line style. Alternatively you can also create a new set of Smart Containers from your spreadsheet to visualize task priorities. In this case during the import flow you would select “priority” as the container name instead of “status.”
Ultimately Smart Containers allow you to visualize spreadsheet data in an easy collaborative workspace.
Whether you need to organize a marketing campaign or simply want to streamline your own workflow try out Smart Containers today to discover the potential of data visualization with Lucidchart! Get started by checking out our templates here!