Idea

Repeat date rows in timeline

Related products:Lucidspark
  • April 9, 2025
  • 3 replies
  • 25 views

Forum|alt.badge.img+1

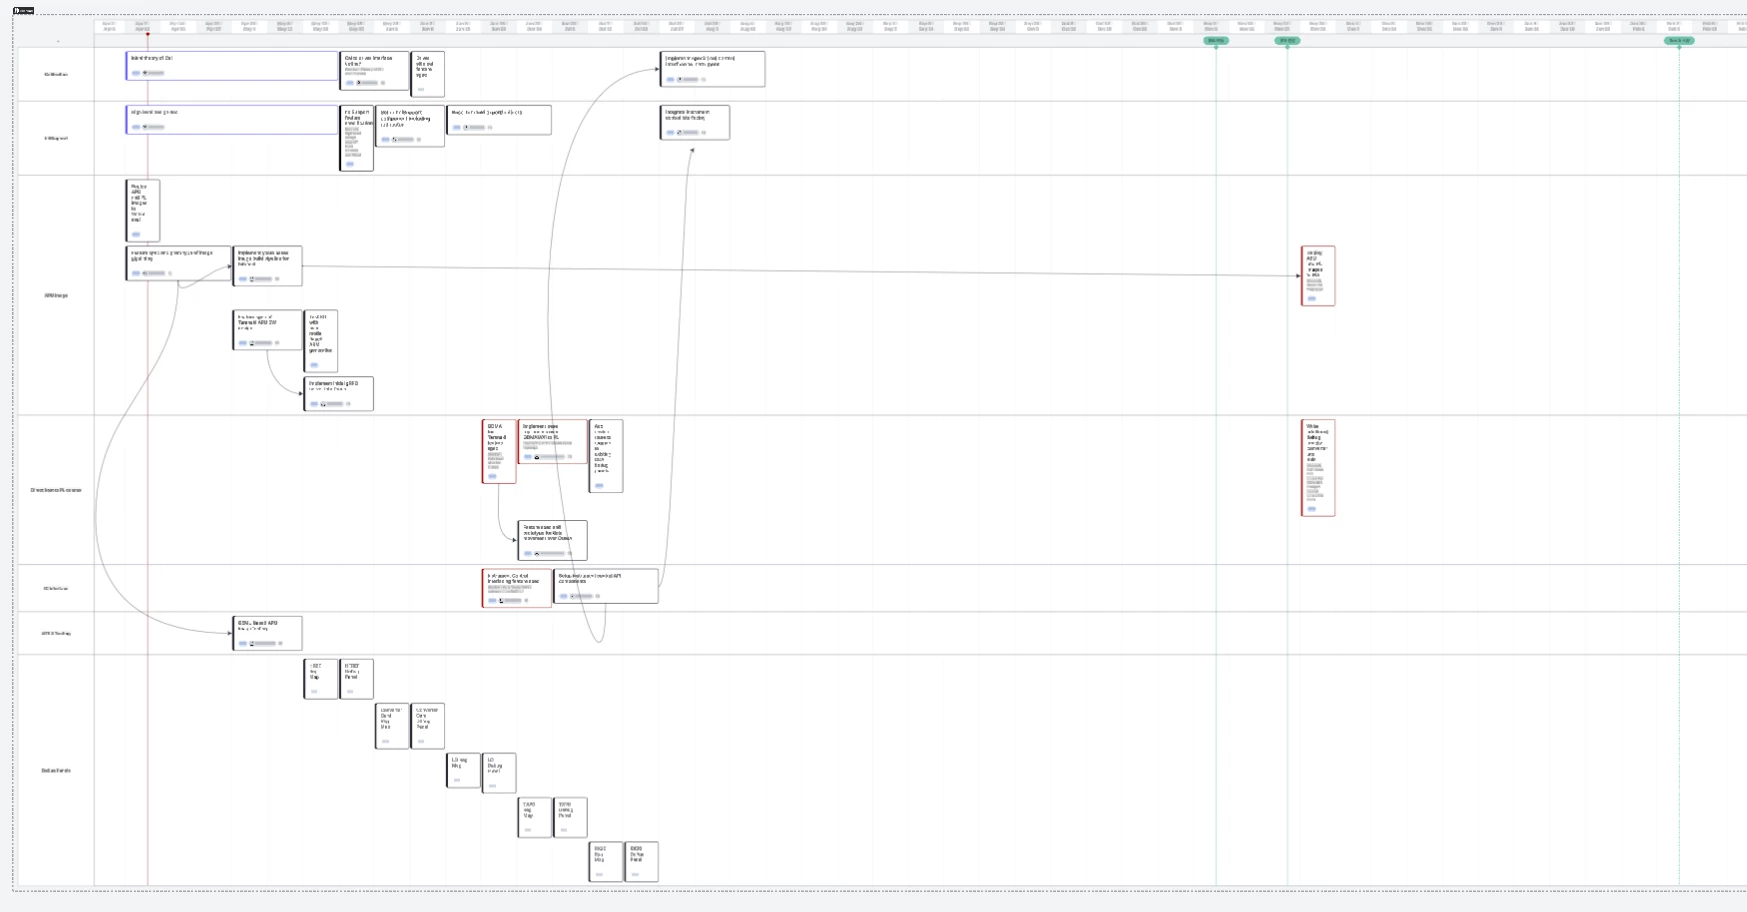
If you have a timeline with a lot of rows that scrolls down enough, you can’t see the dates.  At a minimum, I’d like to be able to repeat the dates at the top and bottom.  Ideally, I’d be able to add date rows between swimlanes so that I can still see the dates when I’m looking in the middle of a larger timeline.  

April 11, 2025

Hi ​@HollyDenghel, thank you for taking the time to share this feedback! To help our team better understand, would you be willing to share a screenshot of your timeline where you cannot see the dates when scrolled down?


We encourage anyone else who’s interested in this to upvote this post and share any additional details about your use case or what you’d like to see in this experience. For more information about how we manage feedback in this community, please take a look at this post:


Comments

Micah
Forum|alt.badge.img+20
  • Lucid community team
  • April 11, 2025

Hi ​@HollyDenghel, thank you for taking the time to share this feedback! To help our team better understand, would you be willing to share a screenshot of your timeline where you cannot see the dates when scrolled down?


We encourage anyone else who’s interested in this to upvote this post and share any additional details about your use case or what you’d like to see in this experience. For more information about how we manage feedback in this community, please take a look at this post:


Forum|alt.badge.img+1

This timeline is set to weeks.  It’s still in work, which is why there are gaps.  We will be adding maybe two or three additional rows, more blocks in the rows, and rearranging dates, but it’s enough to make the point.  I zoomed out to hide the details of the text for the boxes, but when i am zoomed in enough to read the text, with the dates at the top visible, I only get the top three rows.  This is is a smaller example, we have some of these that are 2 or 3 times as tall as this one, which are even worse.  

We may be using this tool in an unexpected way.  We use it to plan projects across teams.  Instead of the rows being a person, they correspond to a feature, a deliverable component, etc.  Kind of a visualization of what will go into a Gantt chart.  It’s helpful for us to see the work across teams in a visual way, and then we move into more detailed planning of the work items themselves.


Micah
Forum|alt.badge.img+20
  • Lucid community team
  • April 11, 2025

@HollyDenghel Thank you so much for this follow-up. I can definitely understand what you’re describing, especially with additional components that extend the height, and agree that a “frozen” or repeating date row would improve this experience. We appreciate you sharing this example and more about your use case!