I have searched the Help and Community but not figured out how to do this, so I’m hoping someone ‘out there’ can provide some insight.
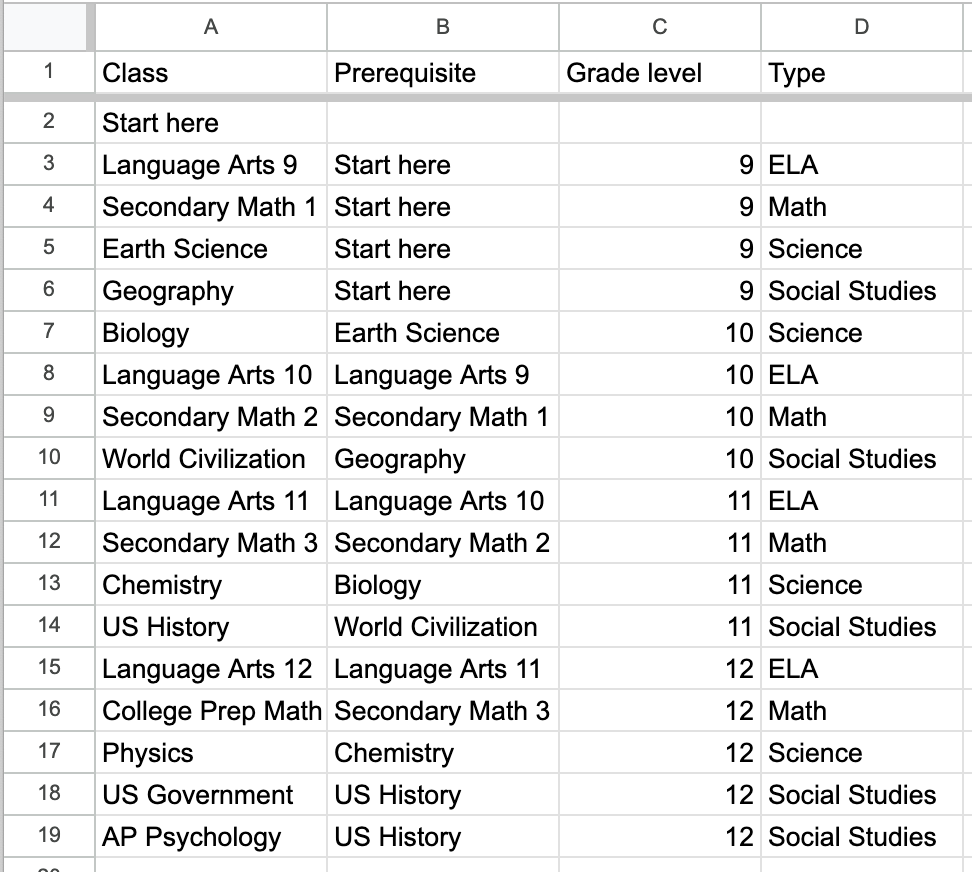
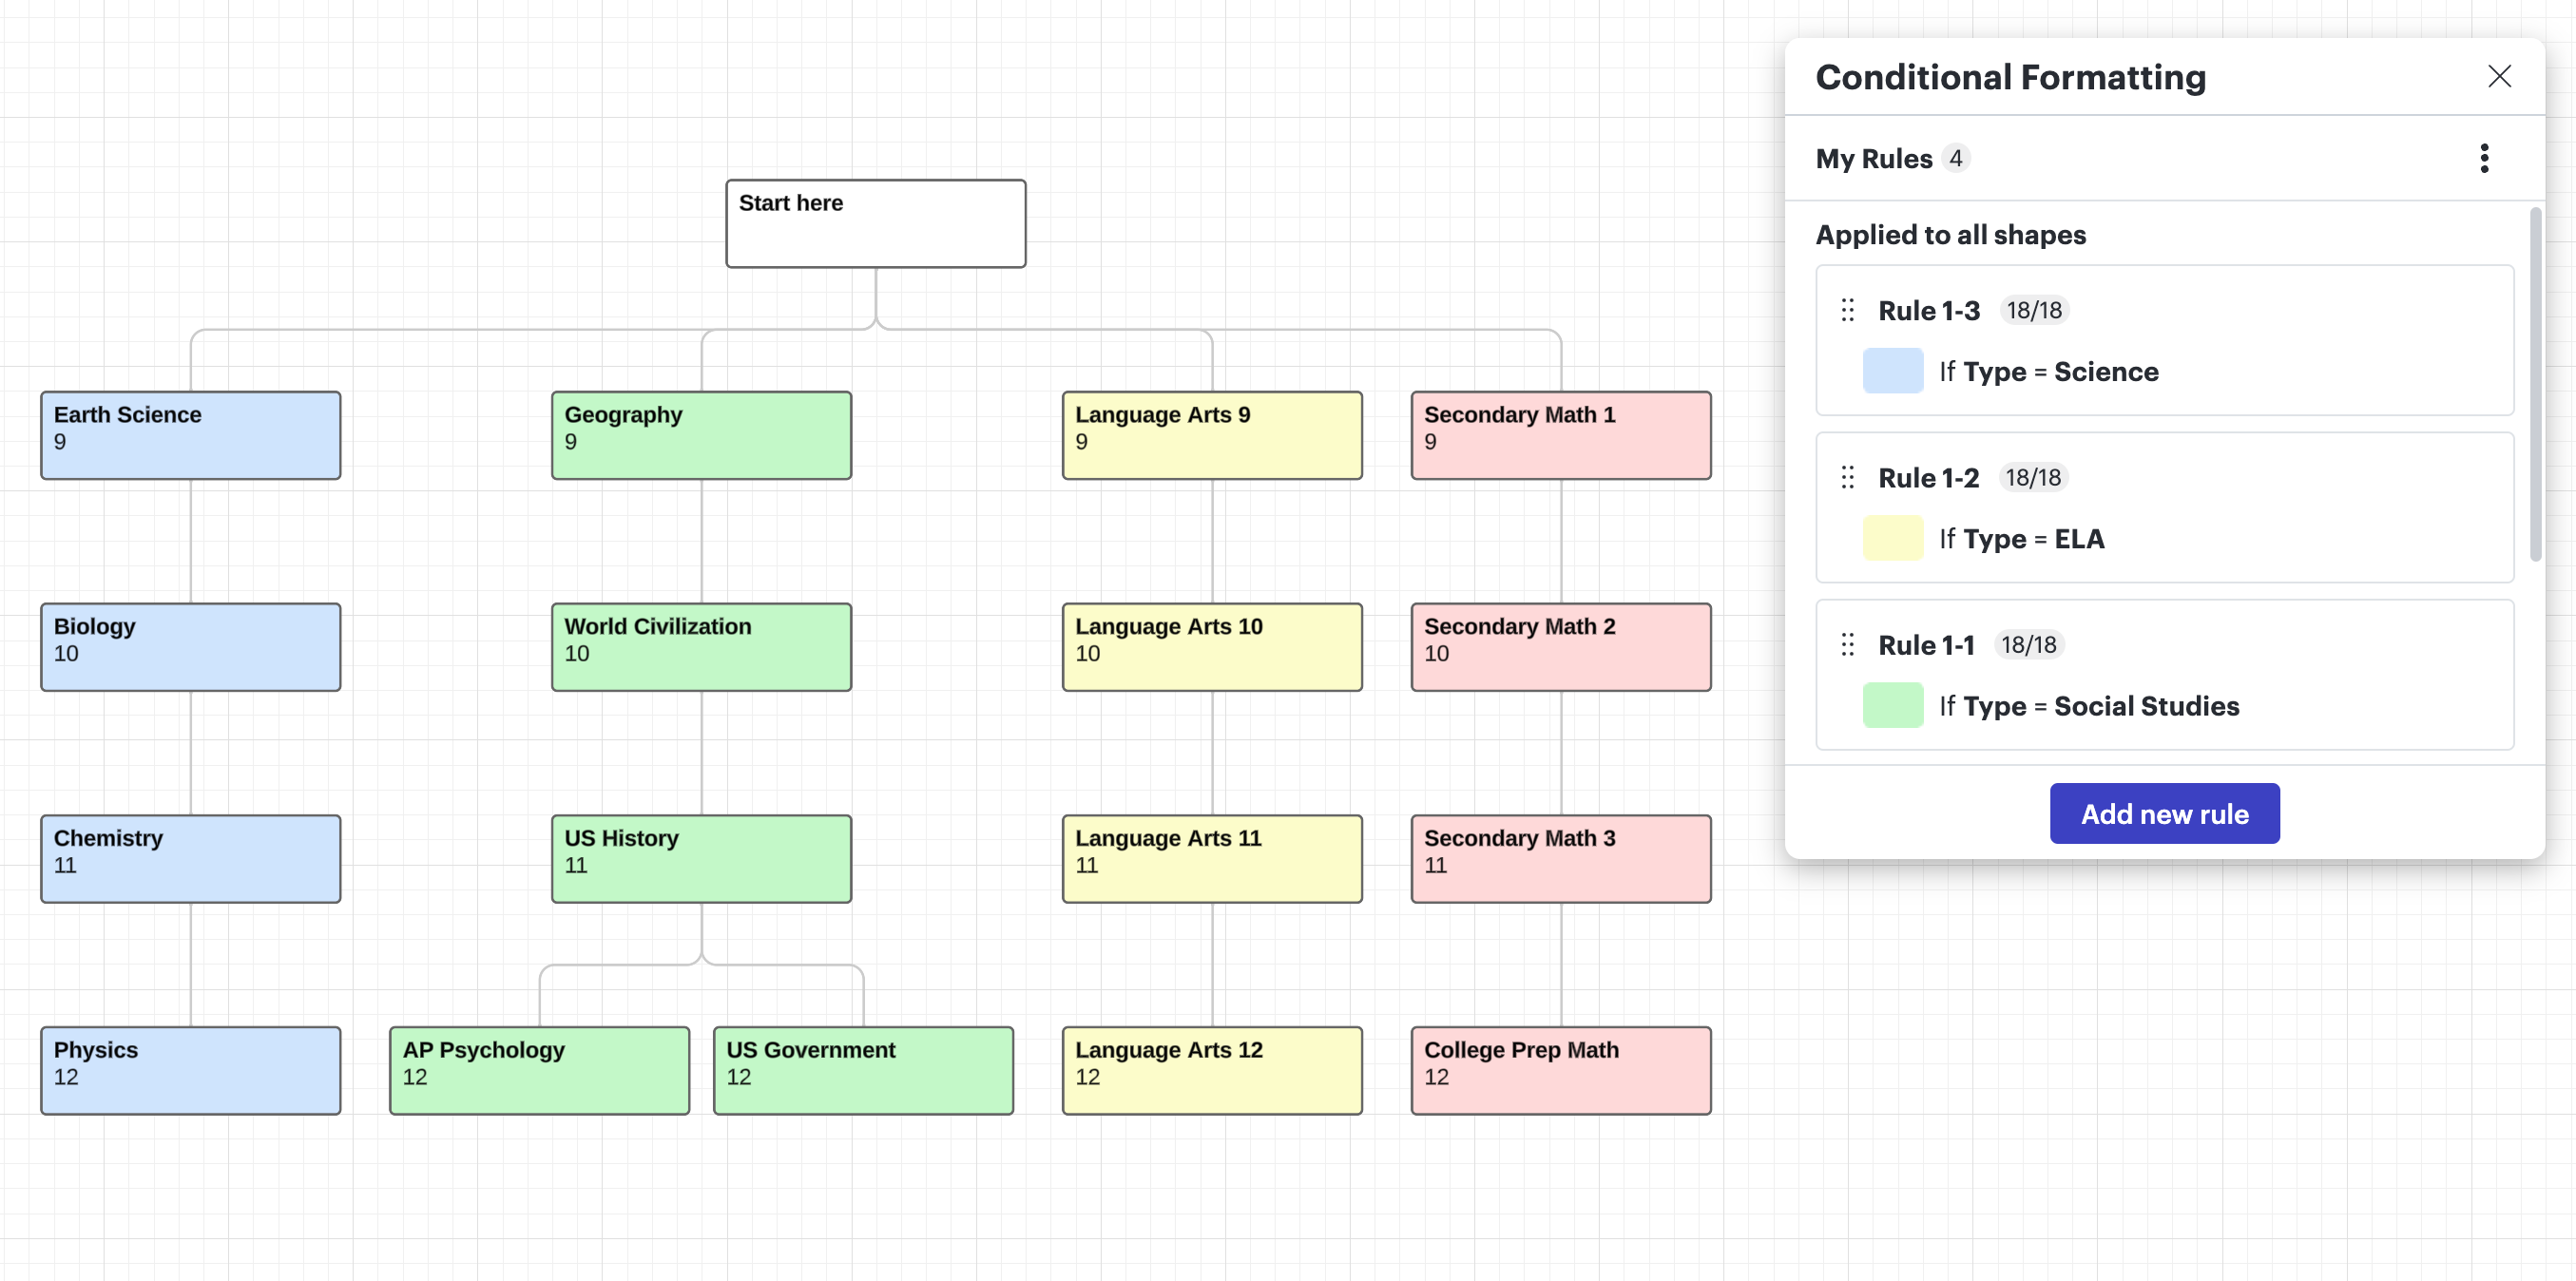
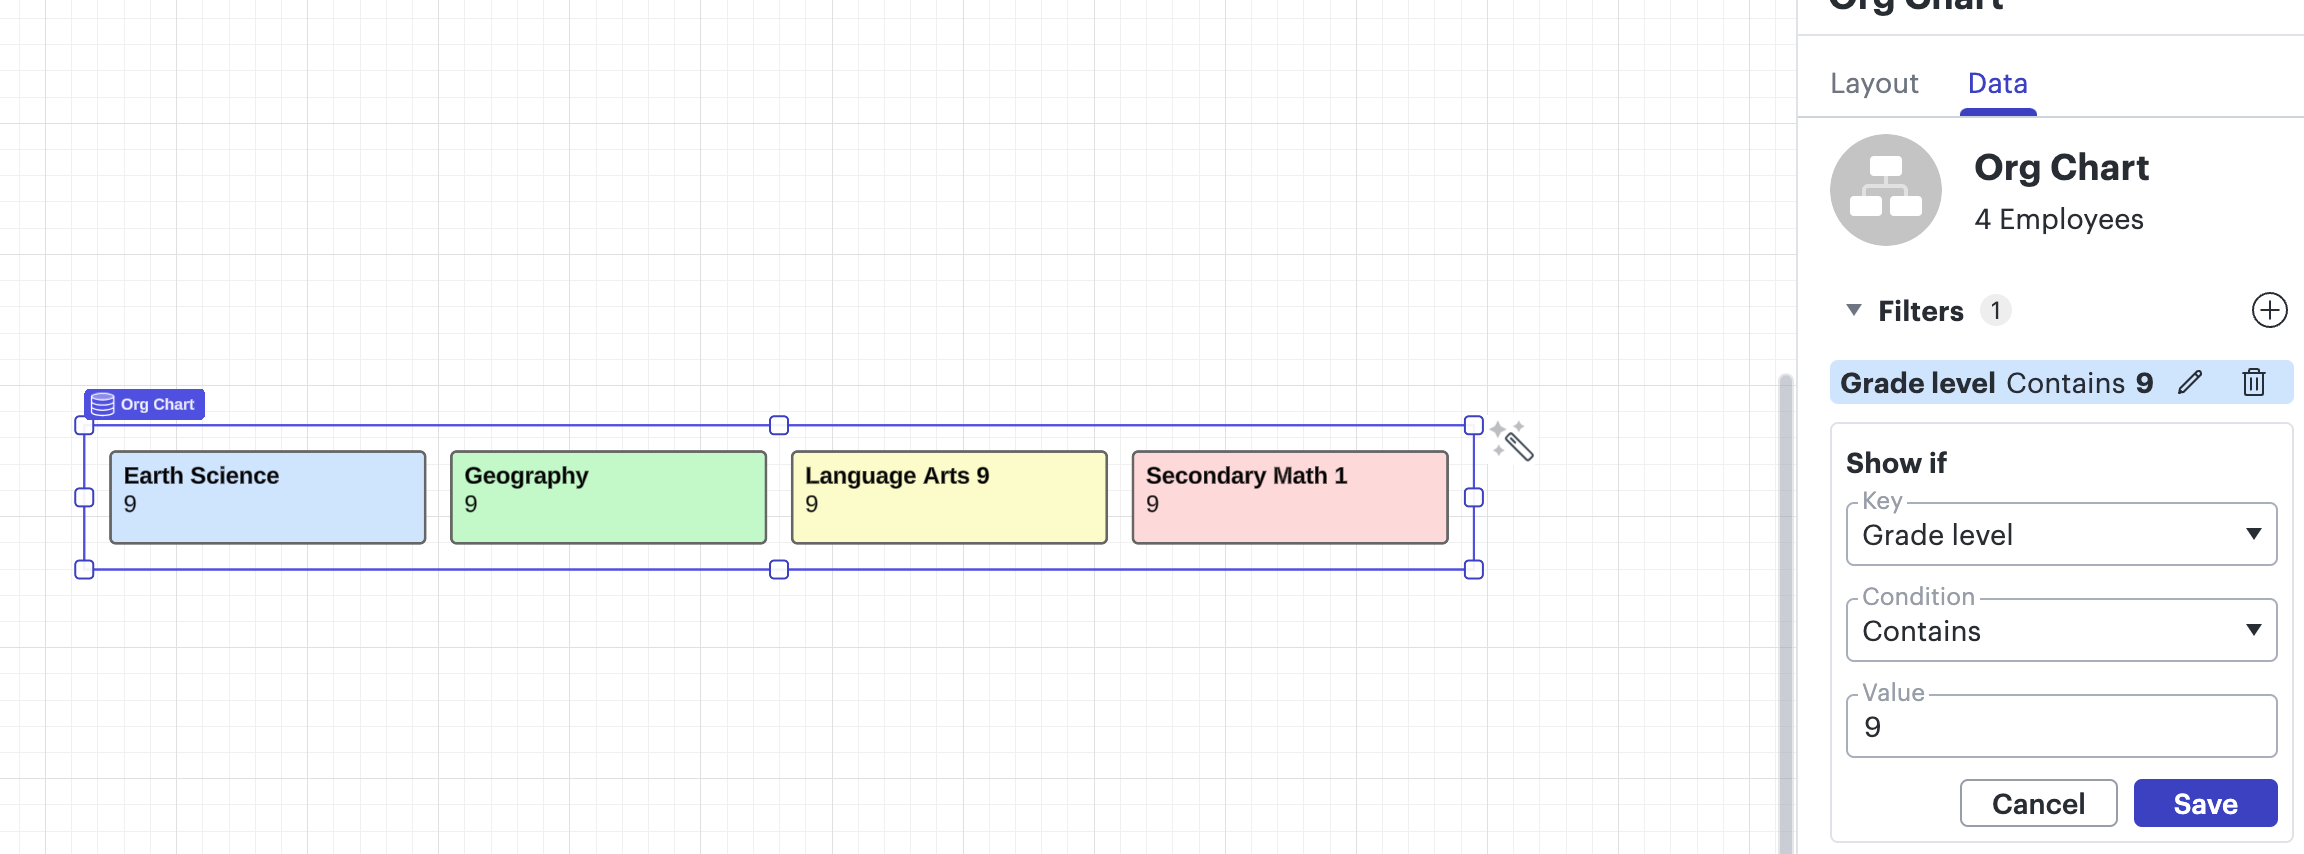
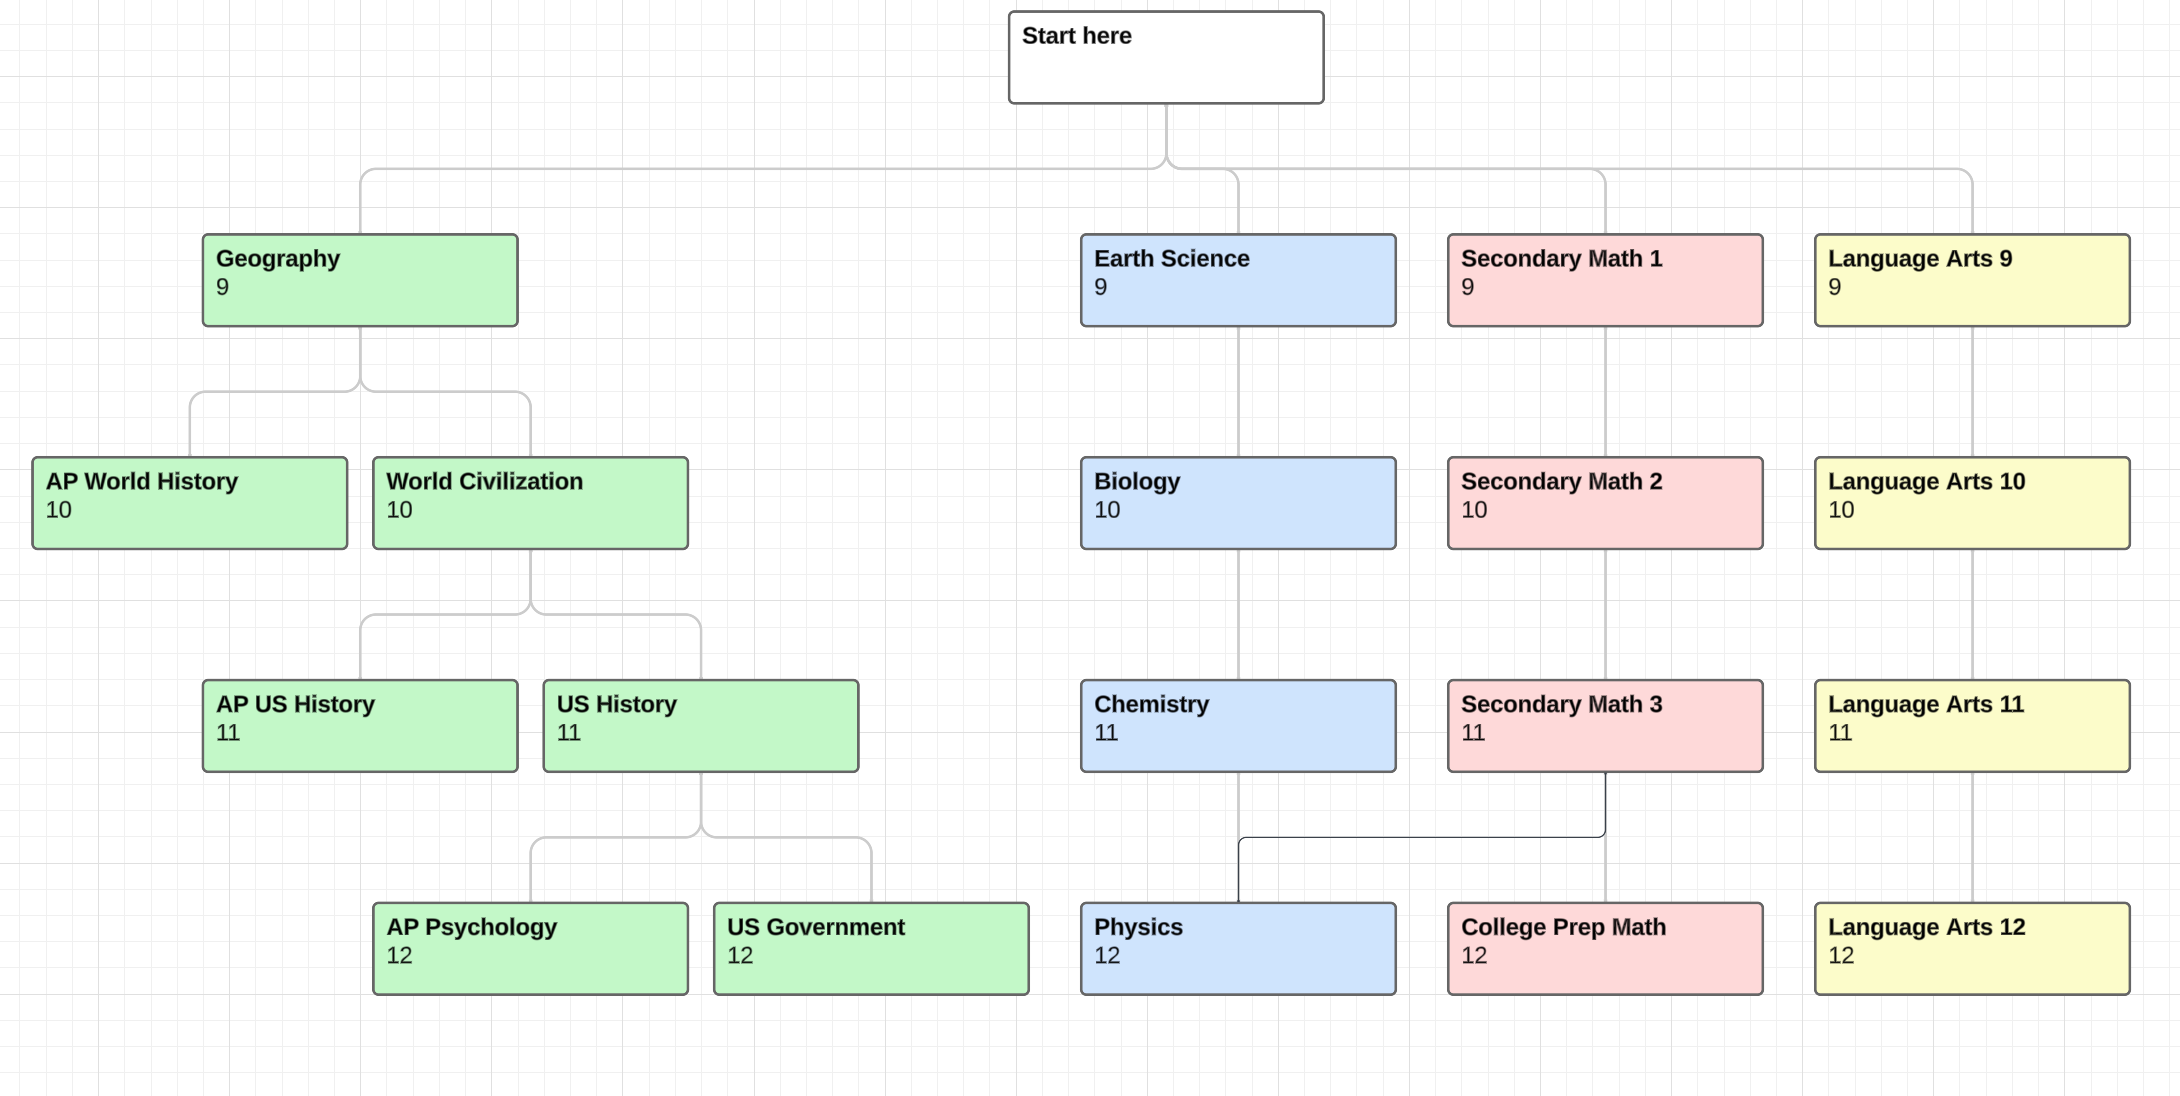
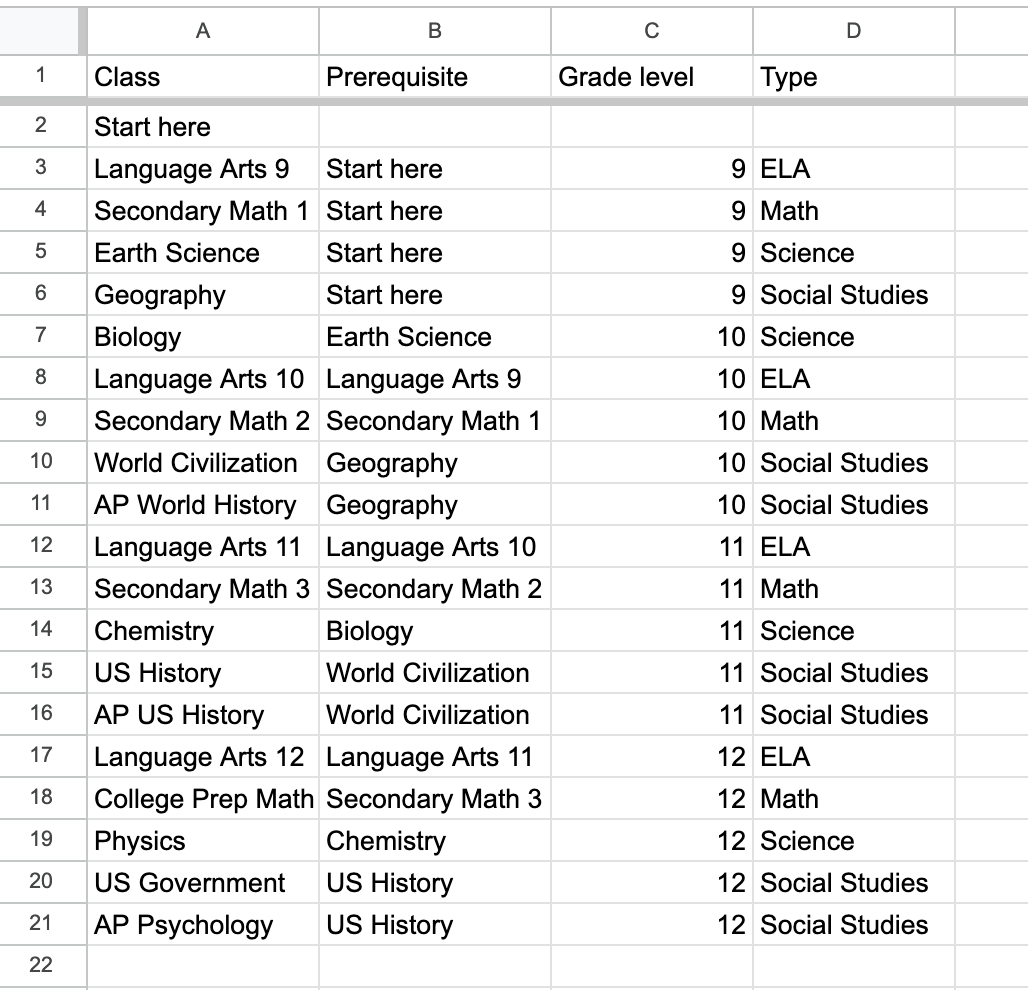
We are a K-12 school and would like to automate the creation of a graphical representation of our course/class offerings. We have a spreadsheet that contains information about every class, including subject, sub-subject, level, type, etc. and want to explore using Lucidchart to visualize it. Ideally, we’d be able to have different views, say one for our Middle School, another for the Upper School, and show it by grade-level, or course level. We want to show the relationship between classes (as in, prerequisites, and natural progression of courses).
How can we do this?
Thanks!